Exhibit 99.1
NYC INVESTOR EVENT October 6, 2022
Some of the statements, estimates or projections contained in this presentation are “forward - looking statements” within the meaning of the U . S . federal securities laws intended to qualify for the safe harbor from liability established by the Private Securities Litigation Reform Act of 1995 . All statements other than statements of historical facts contained in this release, including, without limitation, those regarding our business strategy, financial position, results of operations, plans, prospects, actions taken or strategies being considered with respect to our liquidity position, valuation and appraisals of our assets and objectives of management for future operations (including those regarding expected fleet additions, our expectations regarding the impacts of the COVID - 19 pandemic, Russia’s invasion of Ukraine and general macroeconomic conditions, our expectations regarding cruise voyage occupancy, the implementation of and effectiveness of our health and safety protocols, operational position, demand for voyages, plans or goals for our sustainability program and decarbonization efforts, our expectations for future cash flows and profitability, financing opportunities and extensions, and future cost mitigation and cash conservation efforts and efforts to reduce operating expenses and capital expenditures) are forward - looking statements . Many, but not all, of these statements can be found by looking for words like “expect,” “anticipate,” “goal,” “project,” “plan,” “believe,” “seek,” “will,” “may,” “forecast,” “estimate,” “intend,” “future” and similar words . Forward - looking statements do not guarantee future performance and may involve risks, uncertainties and other factors which could cause our actual results, performance or achievements to differ materially from the future results, performance or achievements expressed or implied in those forward - looking statements . Examples of these risks, uncertainties and other factors include, but are not limited to the impact of : the spread of epidemics, pandemics and viral outbreaks, including the COVID - 19 pandemic, and their effect on the ability or desire of people to travel (including on cruises), which is expected to continue to adversely impact our results, operations, outlook, plans, goals, growth, reputation, cash flows, liquidity, demand for voyages and share price ; implementing precautions in coordination with regulators and global public health authorities to protect the health, safety and security of guests, crew and the communities we visit and to comply with regulatory restrictions related to the pandemic ; our indebtedness and restrictions in the agreements governing our indebtedness that require us to maintain minimum levels of liquidity and be in compliance with maintenance covenants and otherwise limit our flexibility in operating our business, including the significant portion of assets that are collateral under these agreements ; our ability to work with lenders and others or otherwise pursue options to defer, renegotiate, refinance or restructure our existing debt profile, near - term debt amortization, newbuild related payments and other obligations and to work with credit card processors to satisfy current or potential future demands for collateral on cash advanced from customers relating to future cruises ; our need for additional financing or financing to optimize our balance sheet, which may not be available on favorable terms, or at all, and our outstanding exchangeable notes and any future financing which may be dilutive to existing shareholders ; the unavailability of ports of call ; future increases in the price of, or major changes or reduction in, commercial airline services ; changes involving the tax and environmental regulatory regimes in which we operate, including new regulations aimed at reducing greenhouse gas emissions ; the accuracy of any appraisals of our assets as a result of the impact of the COVID - 19 pandemic or otherwise ; our success in controlling operating expenses and capital expenditures ; trends in, or changes to, future bookings and our ability to take future reservations and receive deposits related thereto ; adverse events impacting the security of travel, such as terrorist acts, armed conflict, such as Russia’s invasion of Ukraine, and threats thereof, acts of piracy, and other international events ; adverse incidents involving cruise ships ; adverse general economic and related factors, including as a result of the impact of the COVID - 19 pandemic, Russia’s invasion of Ukraine or otherwise, such as fluctuating or increasing levels of interest rates, inflation, unemployment, underemployment and the volatility of fuel prices, declines in the securities and real estate markets, and perceptions of these conditions that decrease the level of disposable income of consumers or consumer confidence ; breaches in data security or other disturbances to our information technology and other networks or our actual or perceived failure to comply with requirements regarding data privacy and protection ; changes in fuel prices and the type of fuel we are permitted to use and/or other cruise operating costs ; mechanical malfunctions and repairs, delays in our shipbuilding program, maintenance and refurbishments and the consolidation of qualified shipyard facilities ; the risks and increased costs associated with operating internationally ; our inability to recruit or retain qualified personnel or the loss of key personnel or employee relations issues ; our inability to obtain adequate insurance coverage ; pending or threatened litigation, investigations and enforcement actions ; any further impairment of our trademarks, trade names or goodwill ; volatility and disruptions in the global credit and financial markets, which may adversely affect our ability to borrow and could increase our counterparty credit risks, including those under our credit facilities, derivatives, contingent obligations, insurance contracts and new ship progress payment guarantees ; our reliance on third parties to provide hotel management services for certain ships and certain other services ; fluctuations in foreign currency exchange rates ; our expansion into new markets and investments in new markets and land - based destination projects ; overcapacity in key markets or globally ; and other factors set forth under “Risk Factors” in our most recently filed Annual Report on Form 10 - K, Quarterly Report on Form 10 - Q and subsequent filings with the Securities and Exchange Commission . Additionally, many of these risks and uncertainties are currently amplified by and will continue to be amplified by, or in the future may be amplified by, the COVID - 19 pandemic, Russia’s invasion of Ukraine and the impact of general macroeconomic conditions . It is not possible to predict or identify all such risks . There may be additional risks that we consider immaterial or which are unknown . The above examples are not exhaustive and new risks emerge from time to time . Such forward - looking statements are based on our current beliefs, assumptions, expectations, estimates and projections regarding our present and future business strategies and the environment in which we expect to operate in the future . These forward - looking statements speak only as of the date made . We expressly disclaim any obligation or undertaking to release publicly any updates or revisions to any forward - looking statement to reflect any change in our expectations with regard thereto or any change of events, conditions or circumstances on which any such statement was based, except as required by law . 2 FORWARD LOOKING STATEMENTS

Prima Speedway Onda by Scarpetta Indulge Food Hall Mandara Spa Infinity Beach WELCOME ABOARD NORWEGIAN PRIMA
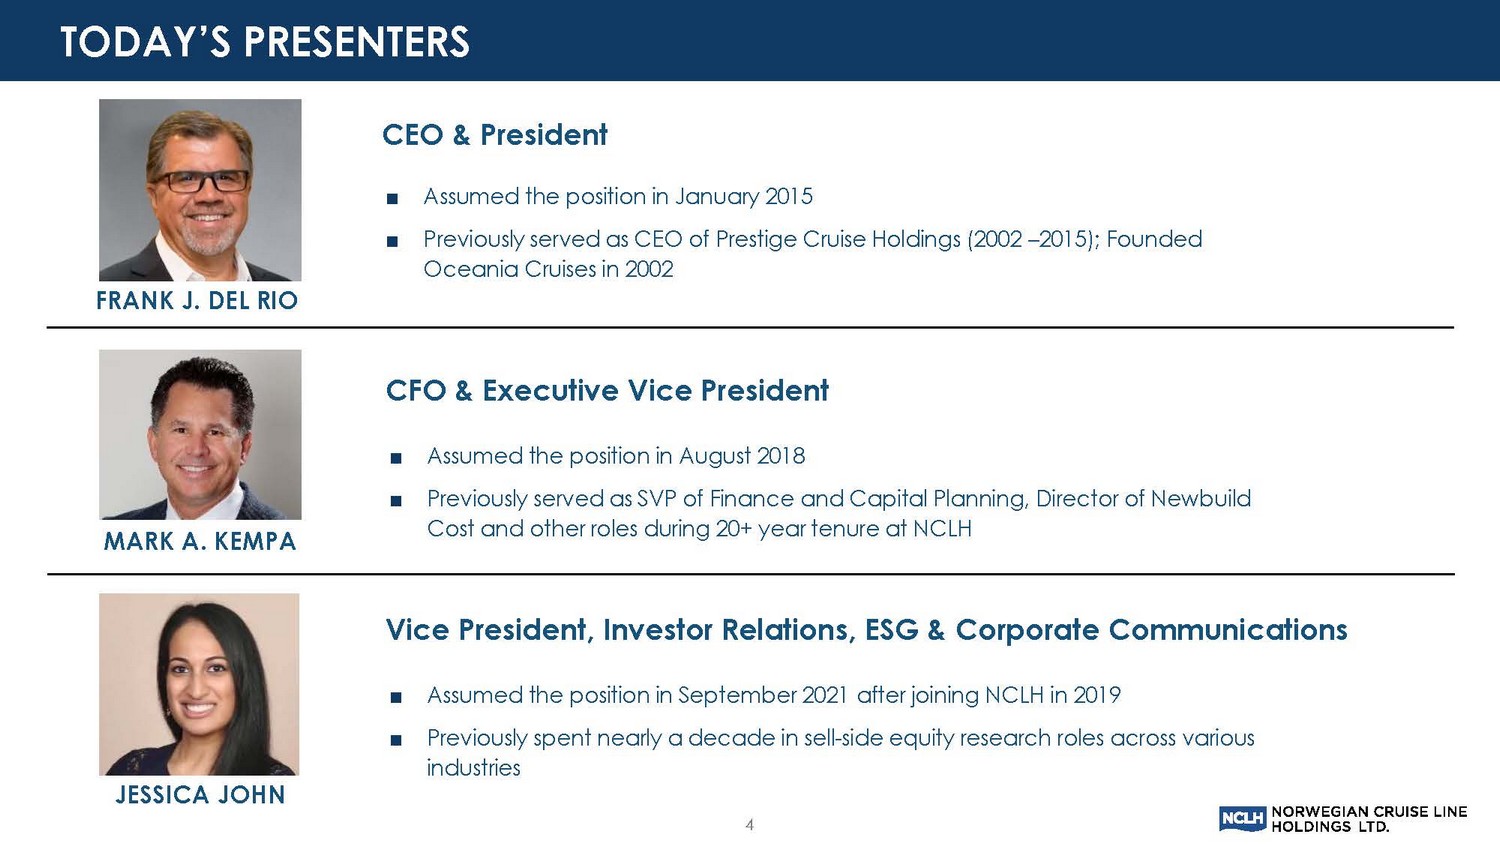
FRANK J. DEL RIO MARK A. KEMPA CEO & President CFO & Executive Vice President ■ Assumed the position in January 2015 ■ Previously served as CEO of Prestige Cruise Holdings (2002 – 2015); Founded Oceania Cruises in 2002 ■ Assumed the position in August 2018 ■ Previously served as SVP of Finance and Capital Planning, Director of Newbuild Cost and other roles during 20+ year tenure at NCLH JESSICA JOHN Vice President, Investor Relations, ESG & Corporate Communications ■ Assumed the position in September 2021 after joining NCLH in 2019 ■ Previously spent nearly a decade in sell - side equity research roles across various industries 4 TODAY’S PRESENTERS
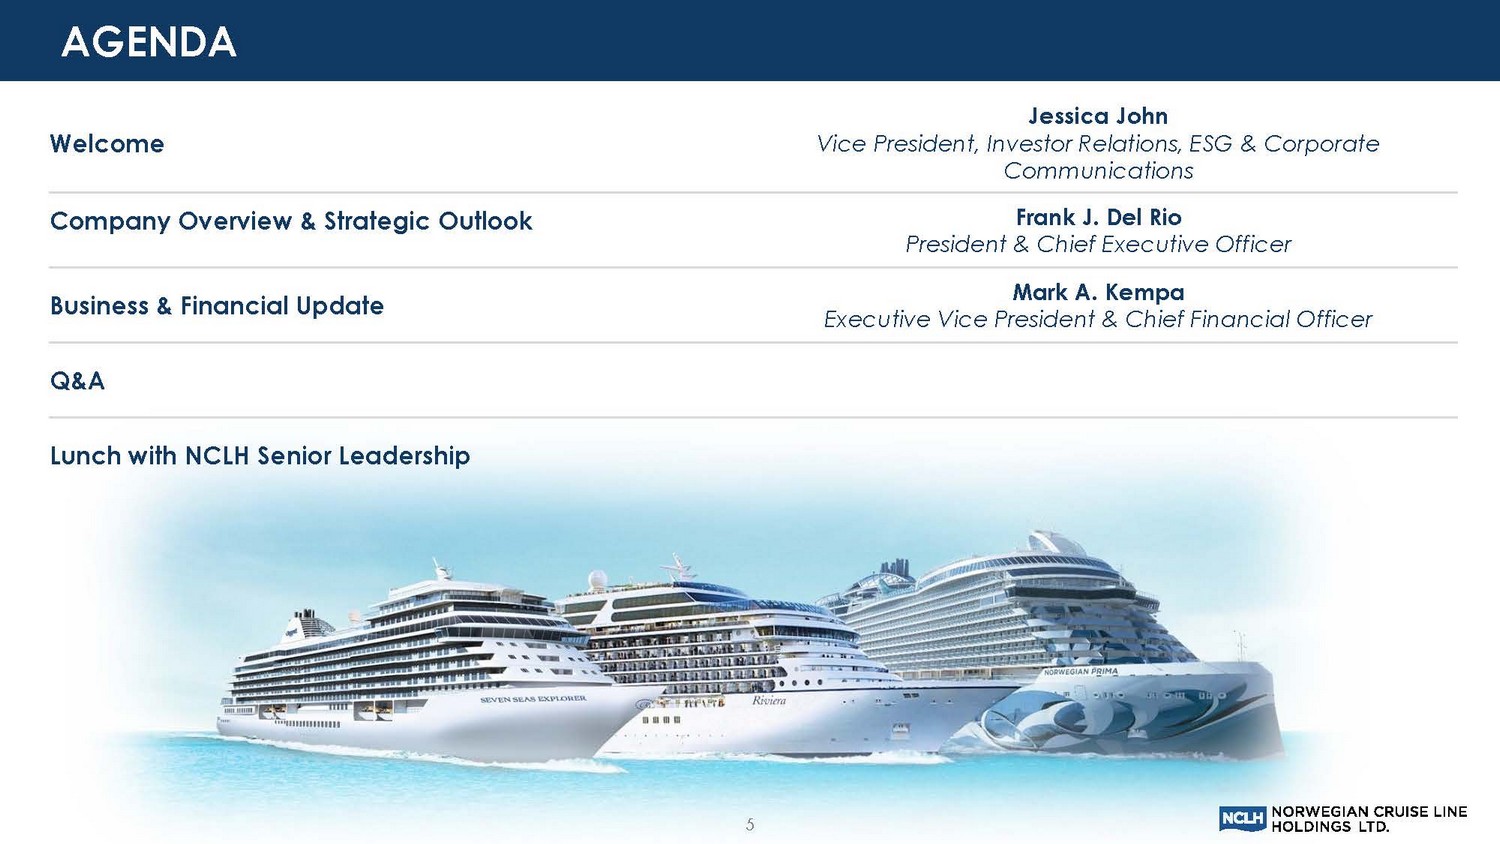
5 Welcome Jessica John Vice President, Investor Relations, ESG & Corporate Communications Company Overview & Strategic Outlook Frank J. Del Rio President & Chief Executive Officer Business & Financial Update Mark A. Kempa Executive Vice President & Chief Financial Officer Q&A Lunch with NCLH Senior Leadership AGENDA
6 COMPANY OVERVIEW & STRATEGIC OUTLOOK
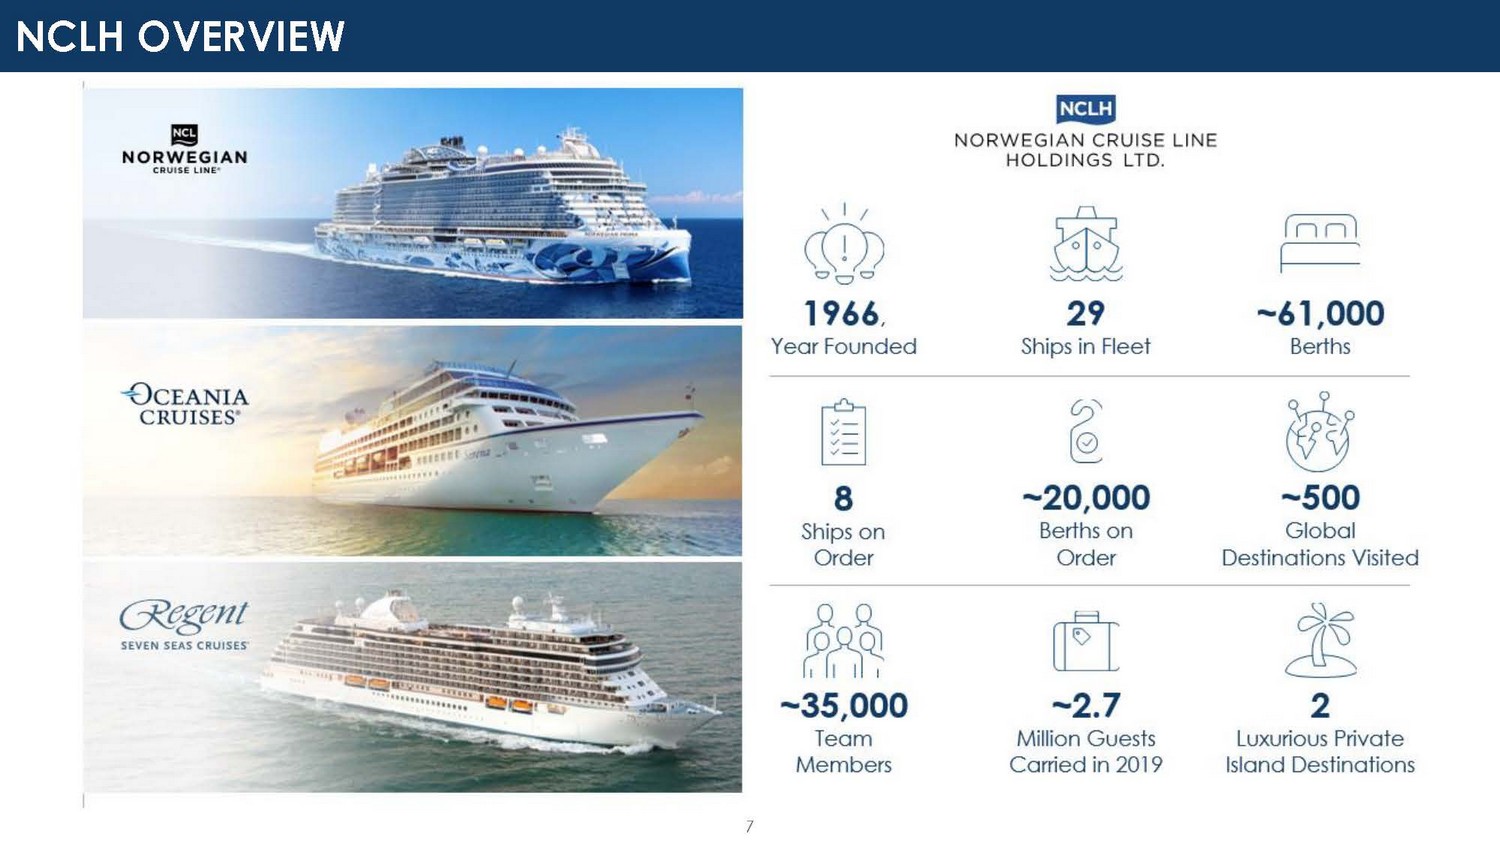
NCLH OVERVIEW 7
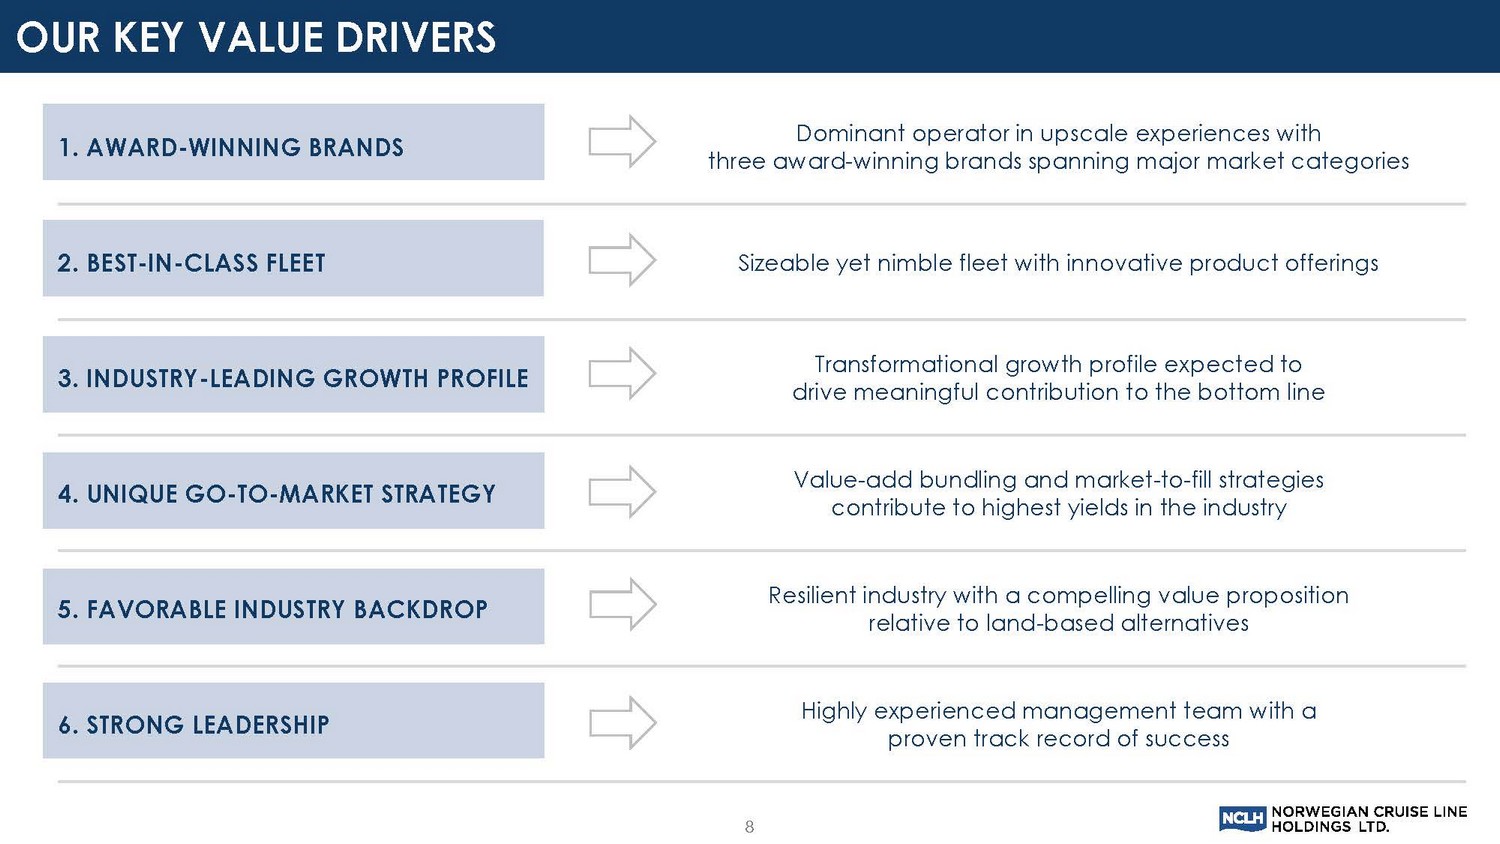
OUR KEY VALUE DRIVERS 1. AWARD - WINNING BRANDS Dominant operator in upscale experiences with three award - winning brands spanning major market categories 2. BEST - IN - CLASS FLEET Sizeable yet nimble fleet with innovative product offerings 3. INDUSTRY - LEADING GROWTH PROFILE Transformational growth profile expected to drive meaningful contribution to the bottom line 4. UNIQUE GO - TO - MARKET STRATEGY Value - add bundling and market - to - fill strategies contribute to highest yields in the industry 5. FAVORABLE INDUSTRY BACKDROP Resilient industry with a compelling value proposition relative to land - based alternatives 6. STRONG LEADERSHIP Highly experienced management team with a proven track record of success 8
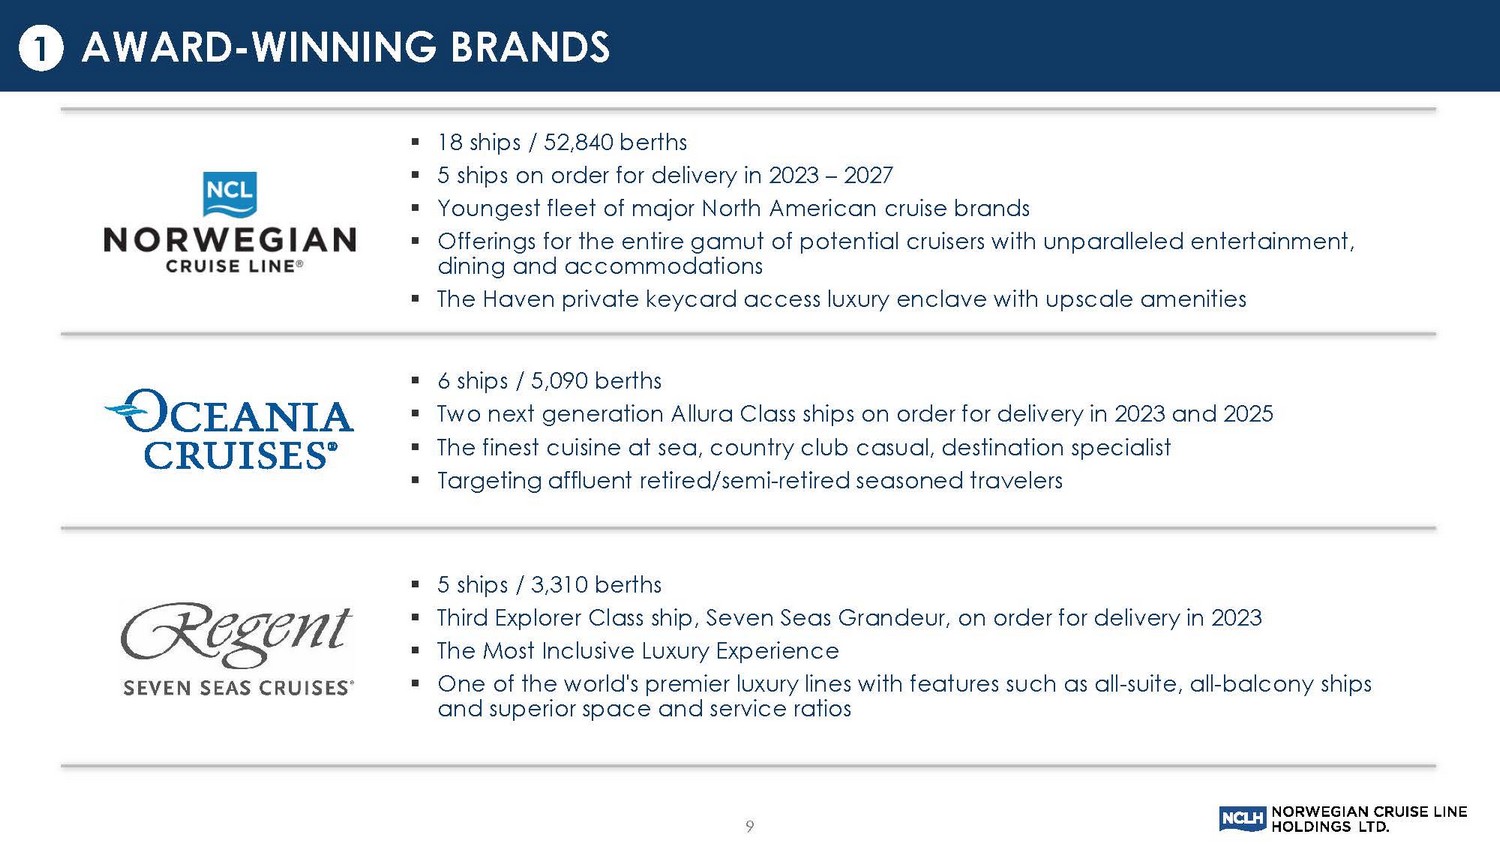
▪ 18 ships / 52,840 berths ▪ 5 ships on order for delivery in 2023 – 2027 ▪ Youngest fleet of major North American cruise brands ▪ Offerings for the entire gamut of potential cruisers with unparalleled entertainment, dining and accommodations ▪ The Haven private keycard access luxury enclave with upscale amenities ▪ 6 ships / 5,090 berths ▪ Two next generation Allura Class ships on order for delivery in 2023 and 2025 ▪ The finest cuisine at sea, country club casual, destination specialist ▪ Targeting affluent retired/semi - retired seasoned travelers ▪ 5 ships / 3,310 berths ▪ Third Explorer Class ship, Seven Seas Grandeur, on order for delivery in 2023 ▪ The Most Inclusive Luxury Experience ▪ One of the world's premier luxury lines with features such as all - suite, all - balcony ships and superior space and service ratios 9 AWARD - WINNING BRANDS 1
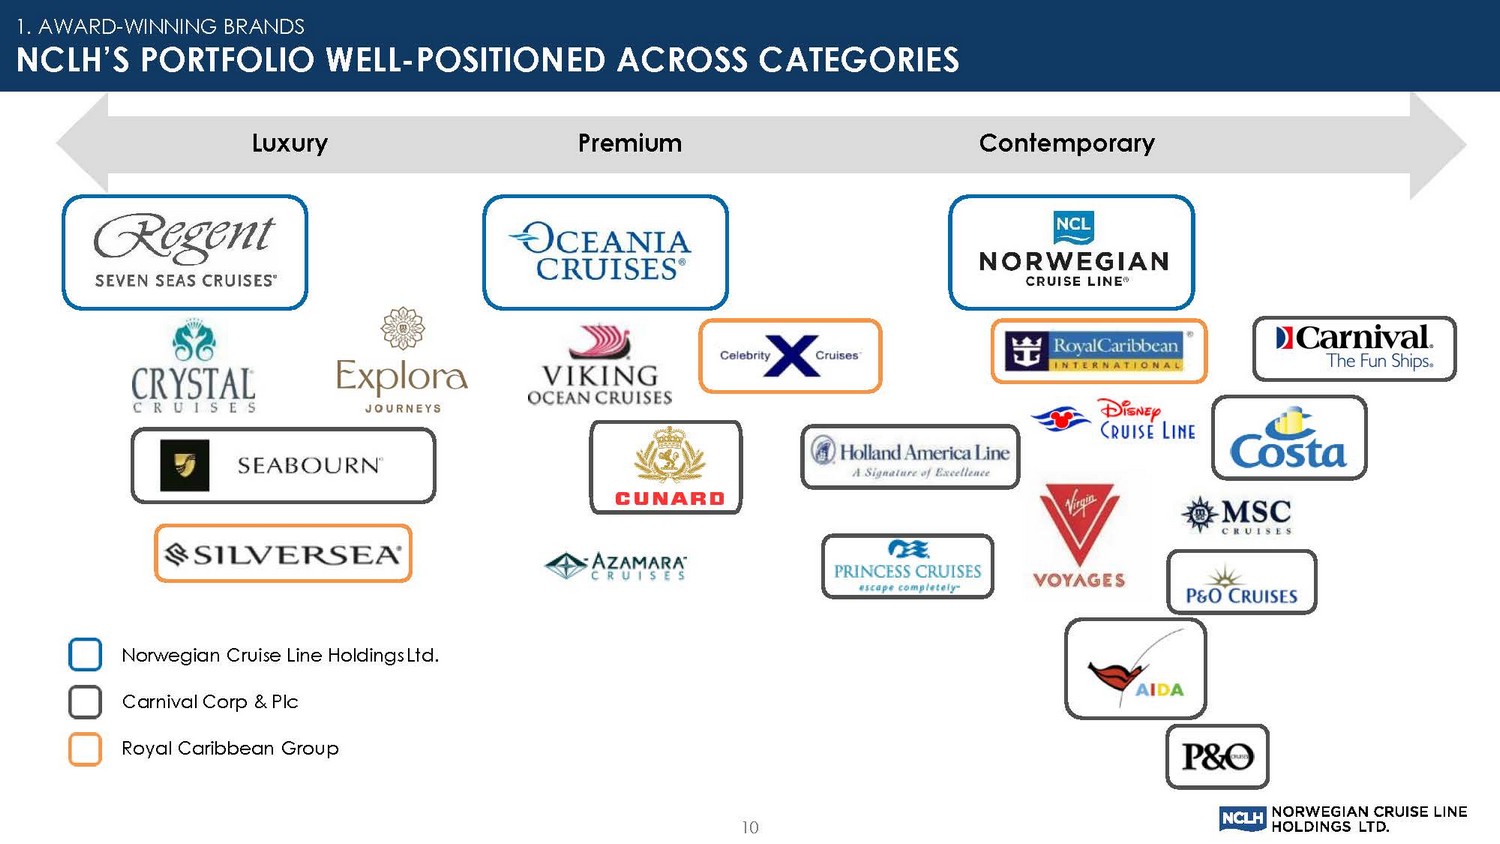
Luxury Premiu m Contemporary Norwegian Cruise Line Holdings Ltd. Carnival Corp & Plc Royal Caribbean Group 1. AWARD - WINNING BRANDS NCLH’S PORTFOLIO WELL - POSITIONED ACROSS CATEGORIES 10
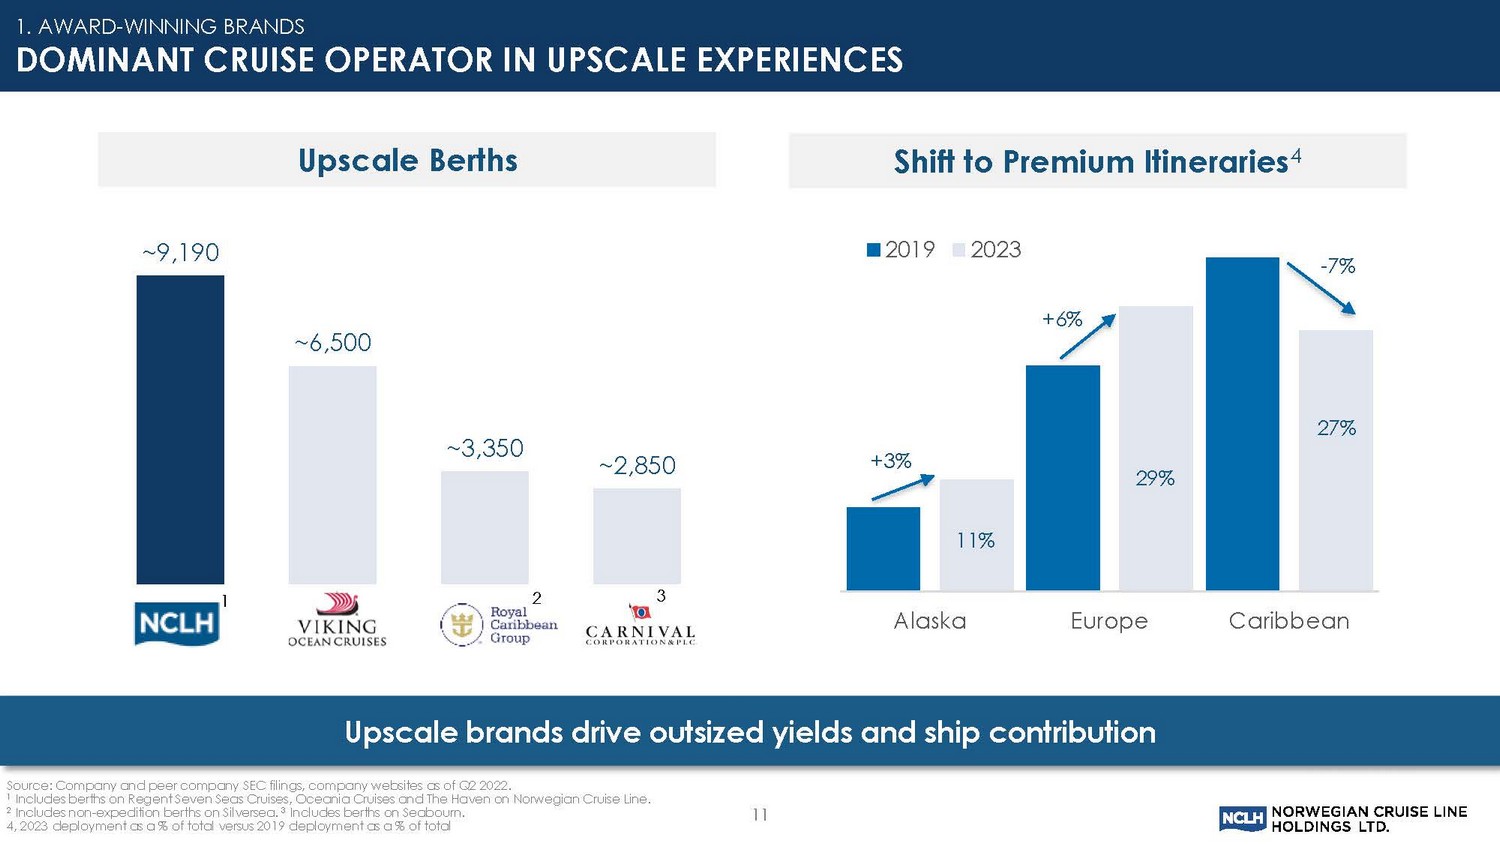
Upscale Berths 1 3 Source: Company and peer company SEC filings, company websites as of Q2 2022. 1 Includes berths on Regent Seven Seas Cruises, Oceania Cruises and The Haven on Norwegian Cruise Line. 2 Includes non - expedition berths on Silversea. 3 Includes berths on Seabourn. 4, 2023 deployment as a % of total versus 2019 deployment as a % of total 2 11 Upscale brands drive outsized yields and ship contribution ~ 9,190 ~ 6,500 ~ 3,350 ~ 2,850 1. AWARD - WINNING BRANDS DOMINANT CRUISE OPERATOR IN UPSCALE EXPERIENCES Shift to Premium Itineraries 4 11% 29% 27% +3% +6% - 7% Alaska Europe Caribbean 2019 2023
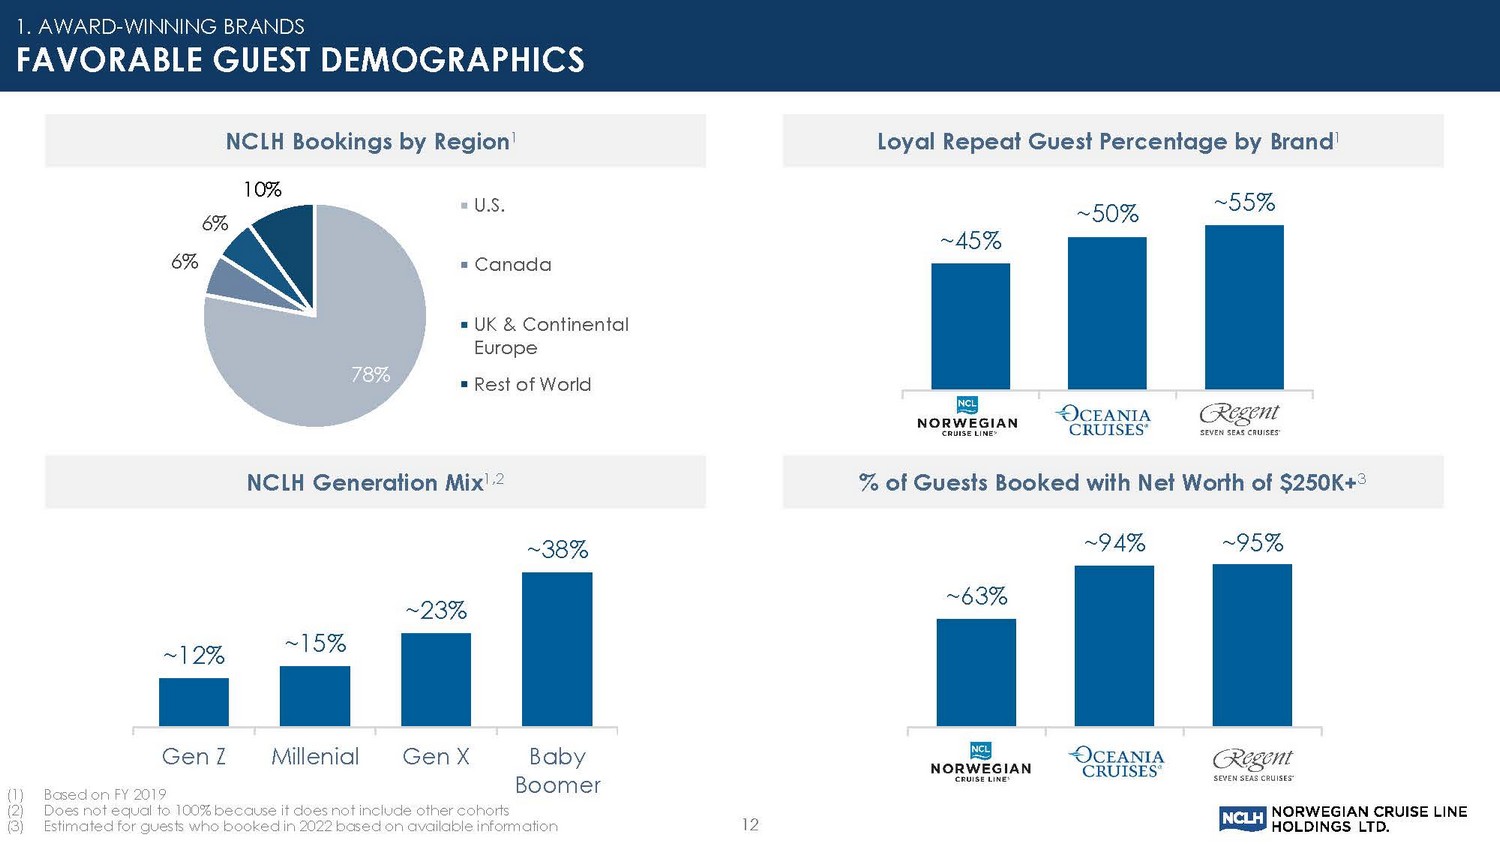
12 1. AWARD - WINNING BRANDS FAVORABLE GUEST DEMOGRAPHICS Loyal Repeat Guest Percentage by Brand 1 NCLH Generation Mix 1,2 % of Guests Booked with Net Worth of $250K+ 3 NCLH Bookings by Region 1 78% 6% 6% 10% U.S. Canada UK & Continental Europe Rest of World ~45% ~50% ~55% NCL OCI RSSC ~ 12% ~ 15% ~ 23% ~ 38% Gen Z Millenial Gen X Baby Boomer ~ 63% ~ 94% ~ 95% NCL OCI RSSC (1) Based on FY 2019 (2) Does not equal to 100% because it does not include other cohorts (3) Estimated for guests who booked in 2022 based on available information
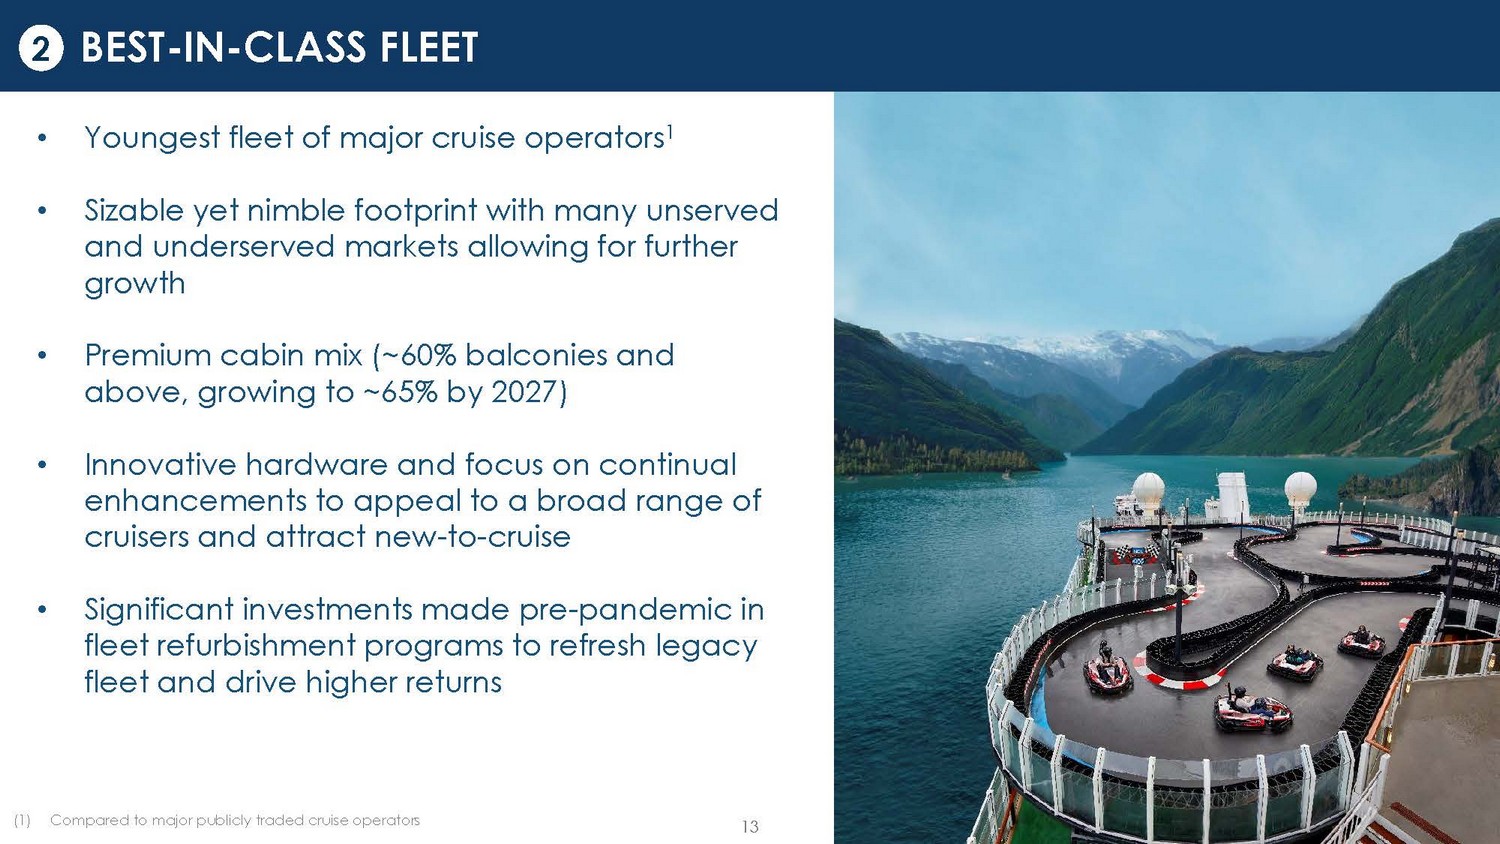
13 • Youngest fleet of major cruise operators 1 • Sizable yet nimble footprint with many unserved and underserved markets allowing for further growth • Premium cabin mix (~60% balconies and above, growing to ~65% by 2027) • Innovative hardware and focus on continual enhancements to appeal to a broad range of cruisers and attract new - to - cruise • Significant investments made pre - pandemic in fleet refurbishment programs to refresh legacy fleet and drive higher returns (1) Compared to major publicly traded cruise operators BEST - IN - CLASS FLEET 2
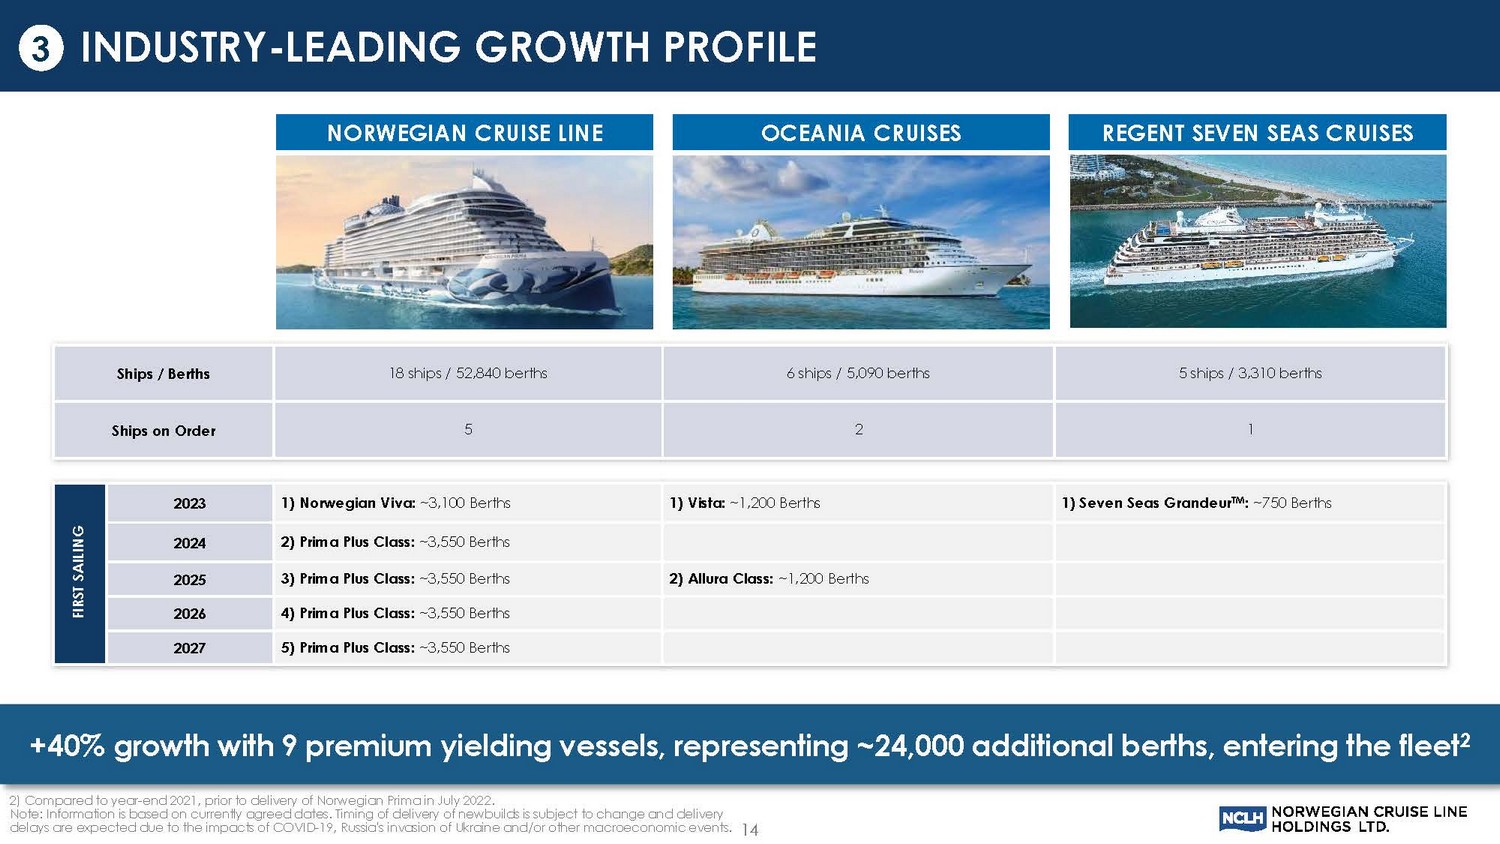
NORWEGIAN CRUISE LINE Ships / Berths 18 ships / 52,840 berths 6 ships / 5,090 berths 5 ships / 3,310 berths Ships on Order 5 2 1 FIRST SAILING 2023 1) Norwegian Viva: ~ 3,100 Berths 1) Vista: ~1,200 Berths 1) Seven Seas Grandeur TM : ~750 Berths 2024 2) Prima Plus Class: ~ 3,550 Berths 2025 3) Prima Plus Class: ~ 3,550 Berths 2) Allura Class: ~1,200 Berths 2026 4) Prima Plus Class: ~ 3,550 Berths 2027 5) Prima Plus Class: ~ 3,550 Berths OCEANIA CRUISES +40% growth with 9 premium yielding vessels, representing ~24,000 additional berths, entering the fleet 2 REGENT SEVEN SEAS CRUISES 14 2) Compared to year - end 2021, prior to delivery of Norwegian Prima in July 2022. Note: Information is based on currently agreed dates. Timing of delivery of newbuilds is subject to change and delivery delays are expected due to the impacts of COVID - 19, Russia's invasion of Ukraine and/or other macroeconomic events. INDUSTRY - LEADING GROWTH PROFILE 3
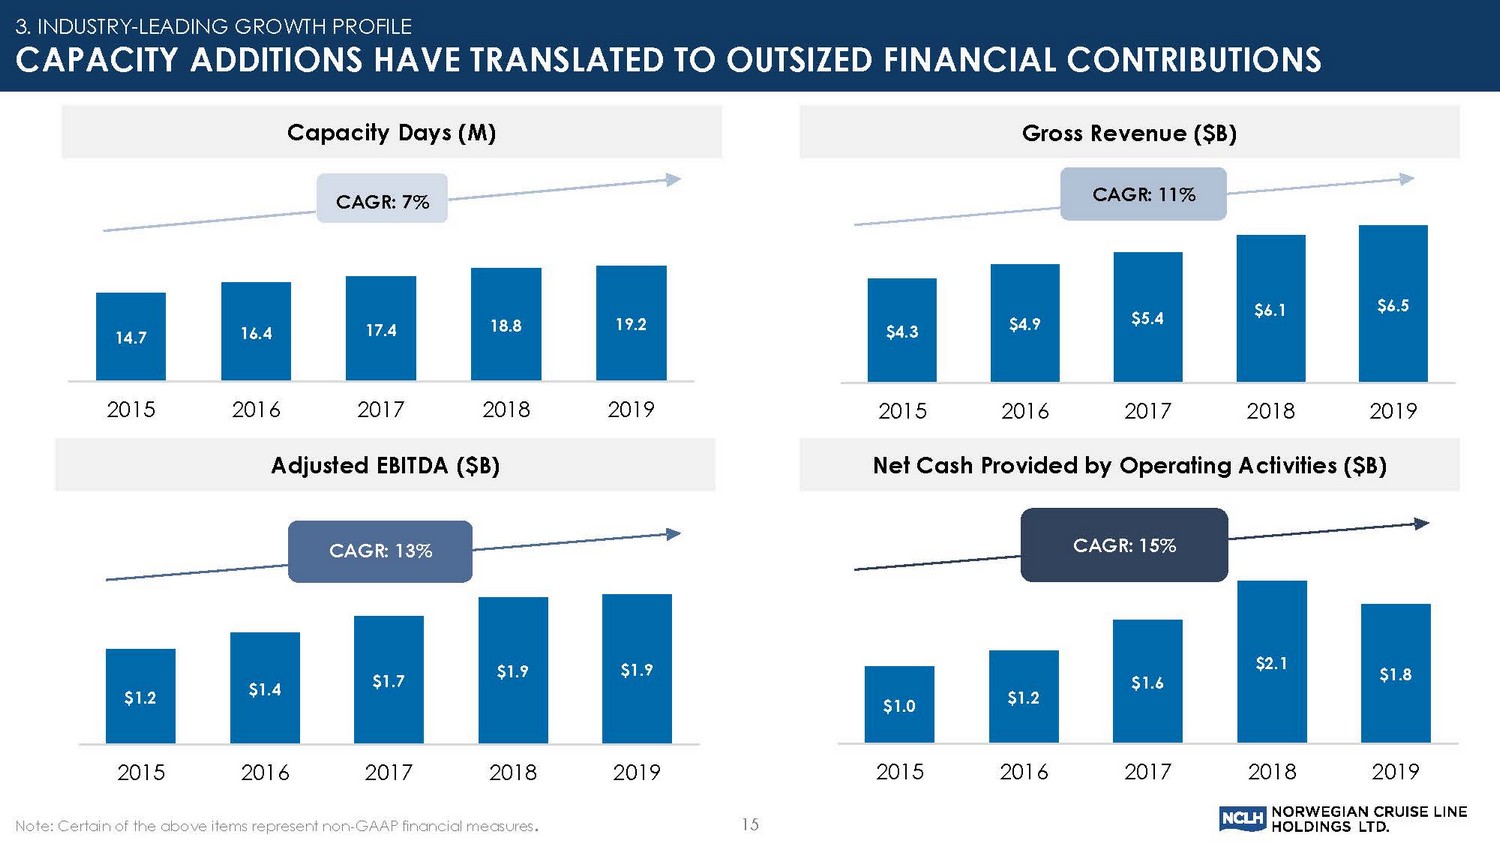
14.7 16.4 17.4 18.8 19.2 2015 2016 2017 2018 2019 Gross Revenue ($B) Adjusted EBITDA ($B) Net Cash Provided by Operating Activities ($B) Note: Certain of the above items represent non - GAAP financial measures . 15 Capacity Days (M) $4.3 $4.9 $5.4 $6.1 $6.5 2015 2016 2017 2018 2019 CAGR: 11% CAGR: 7% CAGR: 13% CAGR: 15% $1.0 $1.2 $1.6 $2.1 $1.8 2015 2016 2017 2018 2019 $1.2 $1.4 $1.7 $1.9 $1.9 2015 2016 2017 2018 2019 3. INDUSTRY - LEADING GROWTH PROFILE CAPACITY ADDITIONS HAVE TRANSLATED TO OUTSIZED FINANCIAL CONTRIBUTIONS
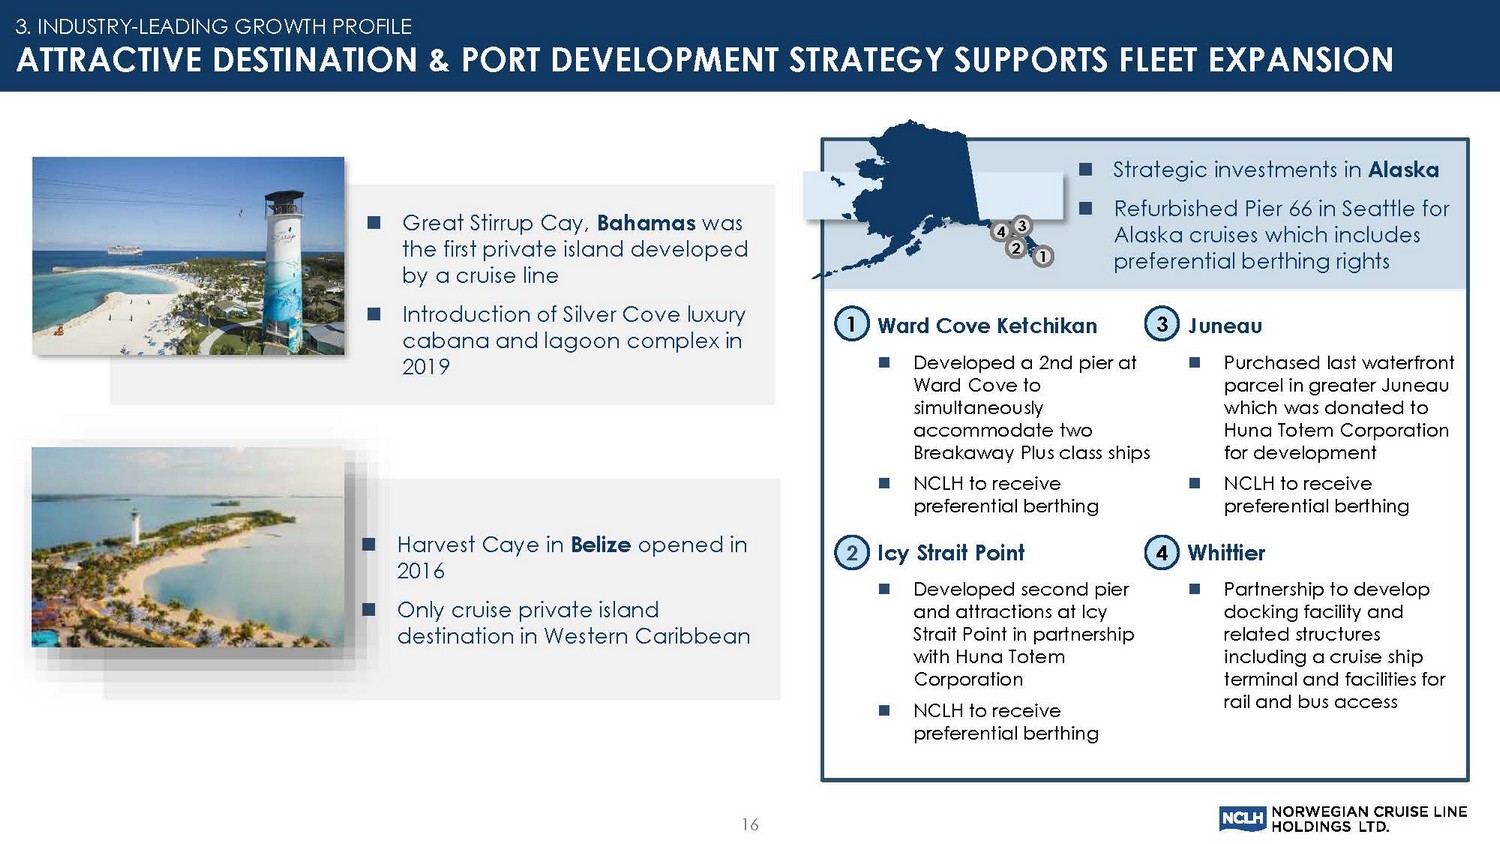
Strategic investments in Alaska Refurbished Pier 66 in Seattle for Alaska cruises which includes preferential berthing rights Harvest Caye in Belize opened in 2016 Only cruise private island destination in Western Caribbean Great Stirrup Cay, Bahamas was the first private island developed by a cruise line Introduction of Silver Cove luxury cabana and lagoon complex in 2019 1 2 3 4 Ward Cove Ketchikan Developed a 2nd pier at Ward Cove to simultaneously accommodate two Breakaway Plus class ships NCLH to receive preferential berthing Juneau Purchased last waterfront parcel in greater Juneau which was donated to Huna Totem Corporation for development NCLH to receive preferential berthing Icy Strait Point Developed second pier and attractions at Icy Strait Point in partnership with Huna Totem Corporation NCLH to receive preferential berthing Whittier Partnership to develop docking facility and related structures including a cruise ship terminal and facilities for rail and bus access 1 2 3 4 16 3. INDUSTRY - LEADING GROWTH PROFILE ATTRACTIVE DESTINATION & PORT DEVELOPMENT STRATEGY SUPPORTS FLEET EXPANSION
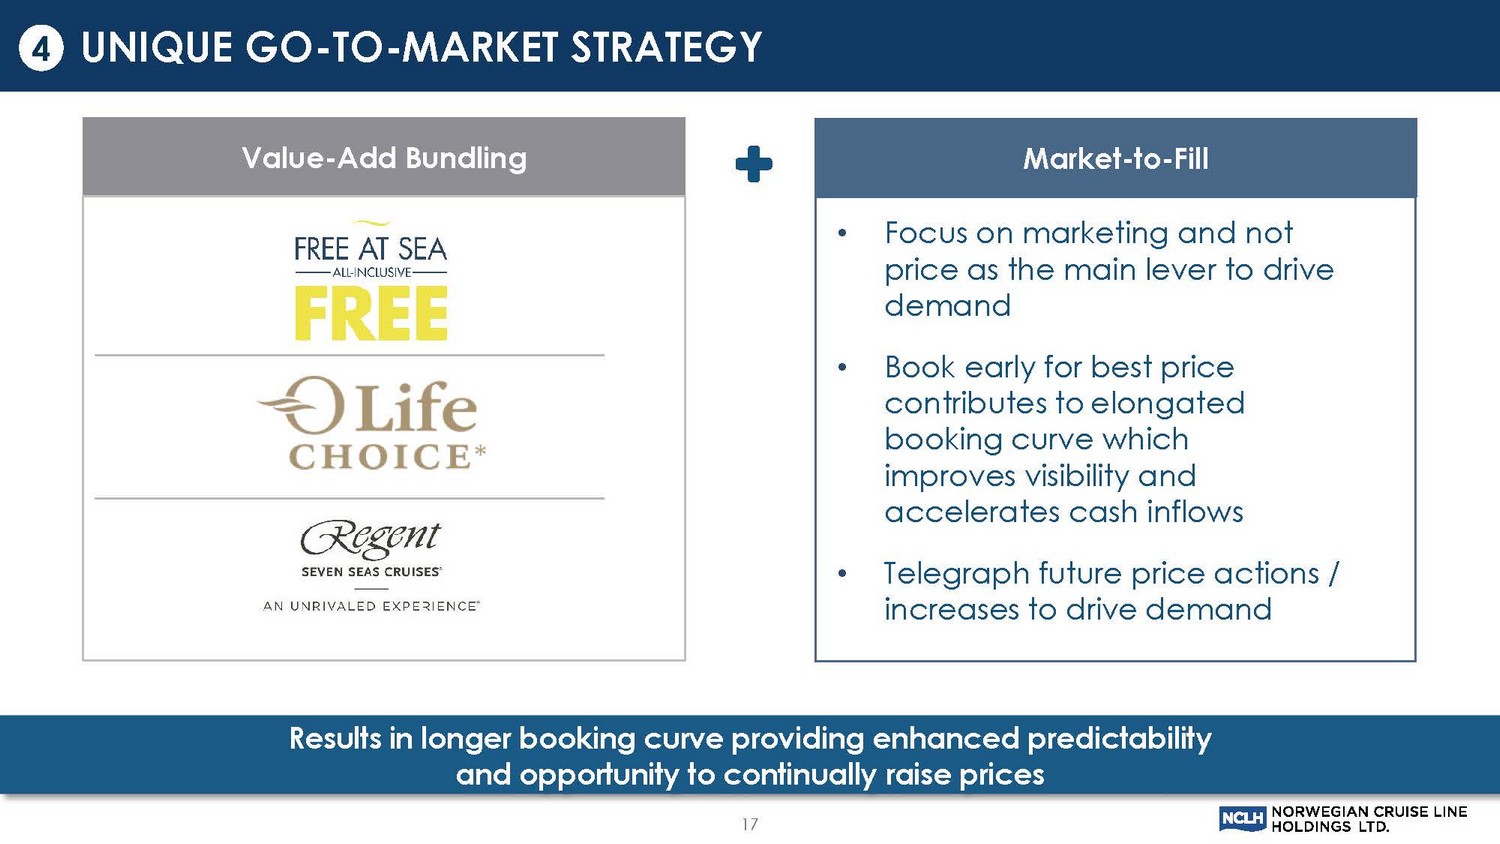
• Focus on marketing and not price as the main lever to drive demand • Book early for best price contributes to elongated booking curve which improves visibility and accelerates cash inflows • Telegraph future price actions / increases to drive demand 17 Results in longer booking curve providing enhanced predictability and opportunity to continually raise prices Value - Add Bundling Market - to - Fill UNIQUE GO - TO - MARKET STRATEGY 4
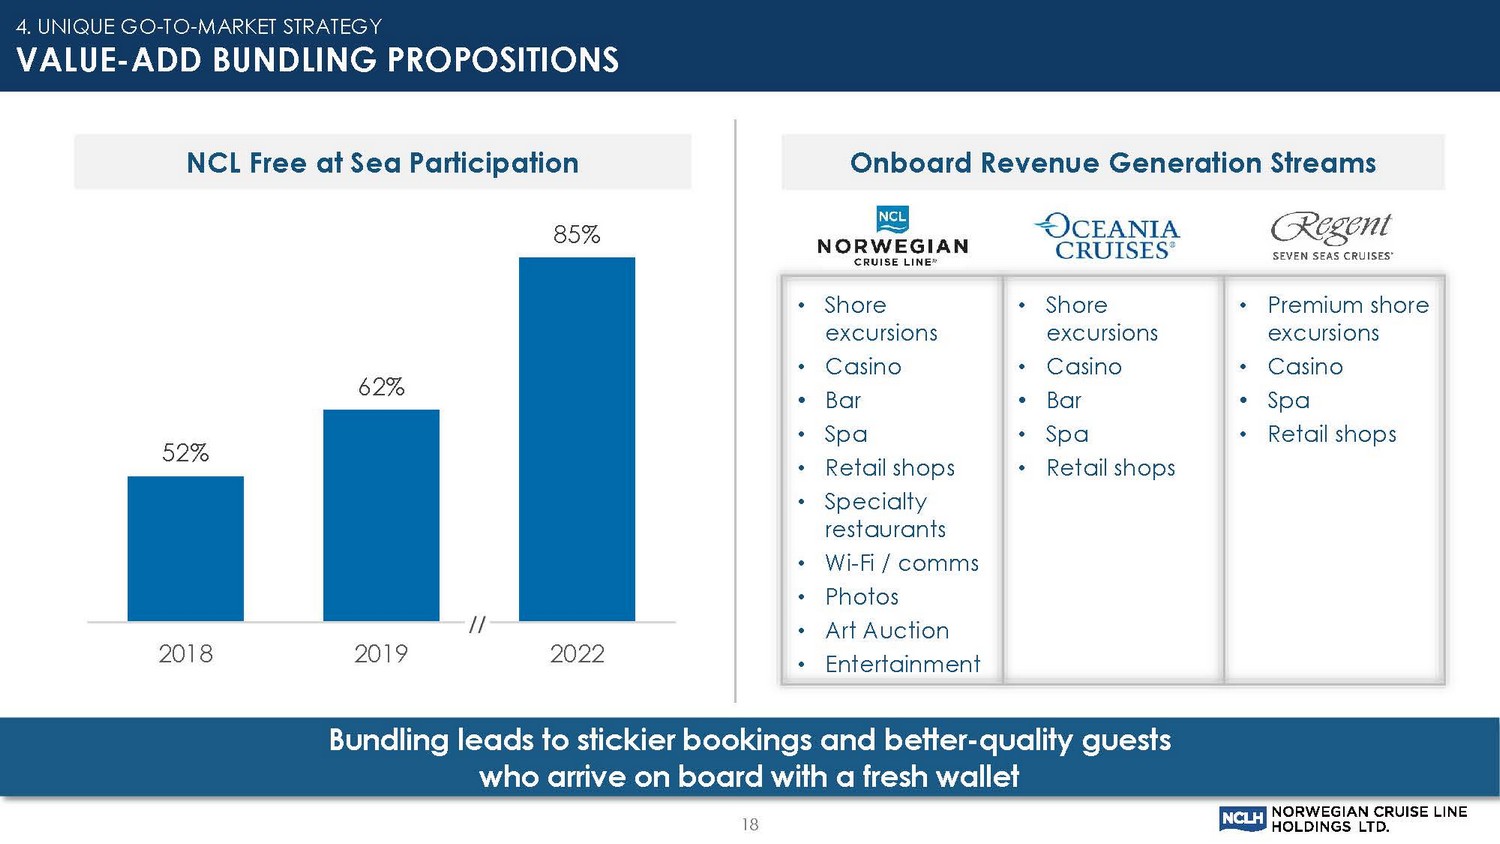
18 4. UNIQUE GO - TO - MARKET STRATEGY VALUE - ADD BUNDLING PROPOSITIONS Bundling leads to stickier bookings and better - quality guests who arrive on board with a fresh wallet NCL Free at Sea Participation Onboard Revenue Generation Streams • Shore excursions • Casino • Bar • Spa • Retail shops • Specialty restaurants • Wi - Fi / comms • Photos • Art Auction • Entertainment • Shore excursions • Casino • Bar • Spa • Retail shops • Premium shore excursions • Casino • Spa • Retail shops 52% 62% 85% 2018 2019 2022
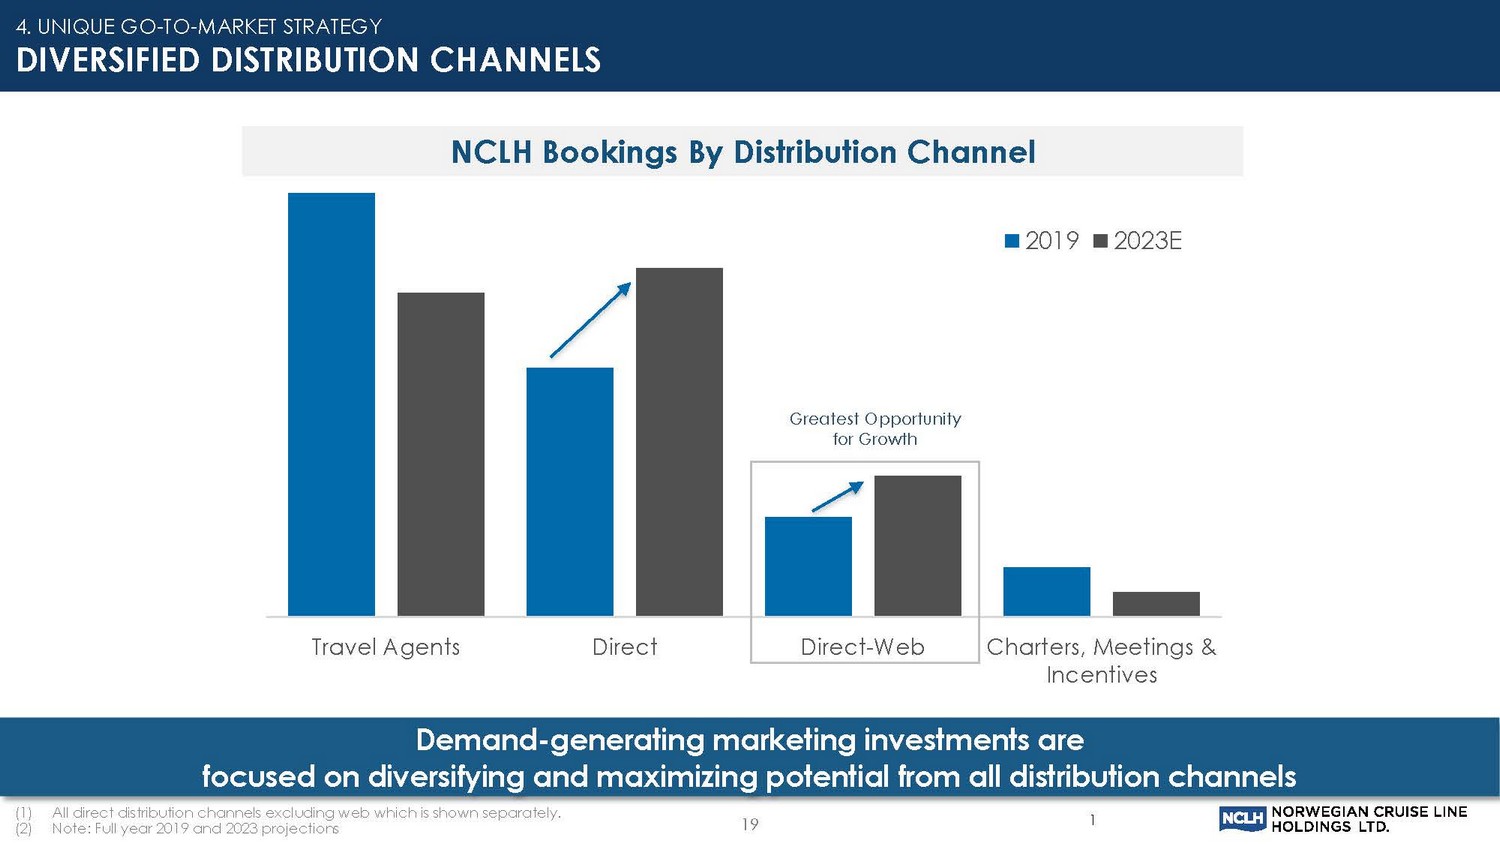
Travel Agents Direct Direct-Web Charters, Meetings & Incentives 2019 2023E 4. UNIQUE GO - TO - MARKET STRATEGY DIVERSIFIED DISTRIBUTION CHANNELS Demand - generating marketing investments are focused on diversifying and maximizing potential from all distribution channels NCLH Bookings By Distribution Channel (1) All direct distribution channels excluding web which is shown separately. (2) Note: Full year 2019 and 2023 projections 1 Greatest Opportunity for Growth 19
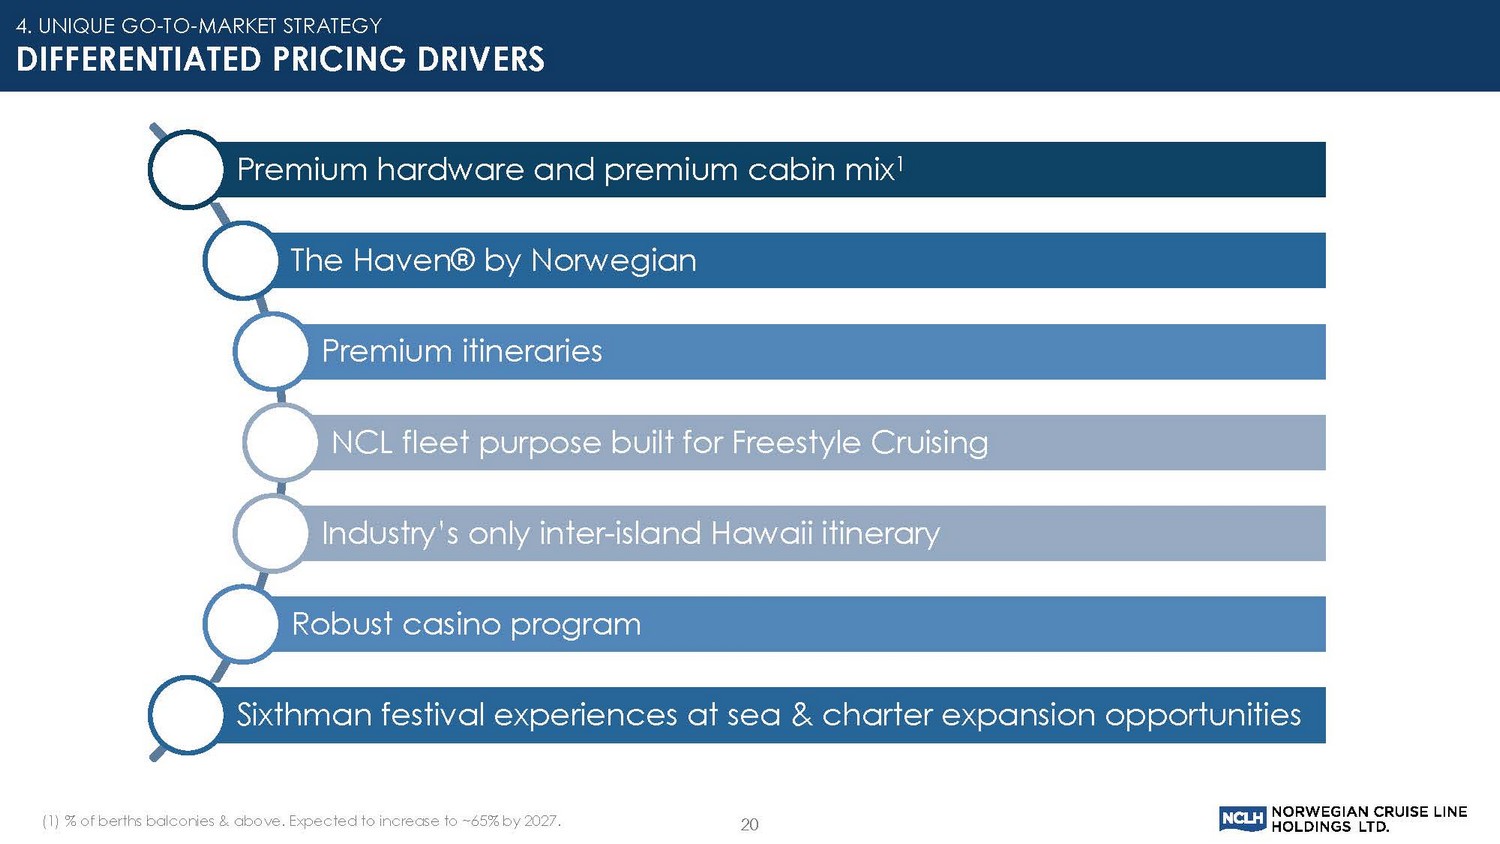
20 4. UNIQUE GO - TO - MARKET STRATEGY DIFFERENTIATED PRICING DRIVERS Premium hardware and premium cabin mix 1 The Haven® by Norwegian Premium itineraries NCL fleet purpose built for Freestyle Cruising Industry’s only inter - island Hawaii itinerary Robust casino program Sixthman festival experiences at sea & charter expansion opportunities (1) % of berths balconies & above. Expected to increase to ~65% by 2027.
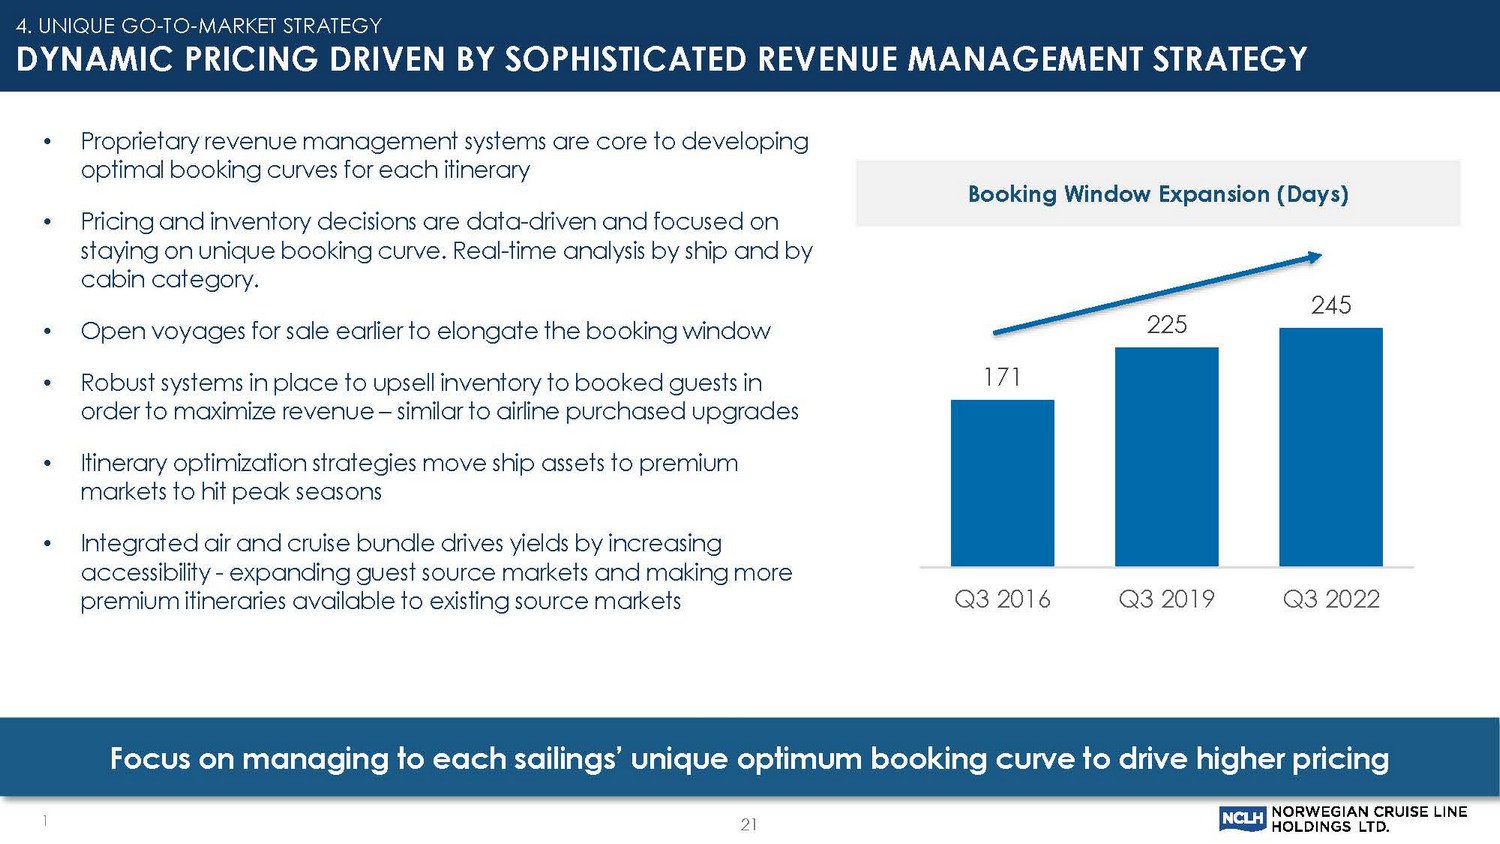
21 4. UNIQUE GO - TO - MARKET STRATEGY DYNAMIC PRICING DRIVEN BY SOPHISTICATED REVENUE MANAGEMENT STRATEGY 1 • Proprietary revenue management systems are core to developing optimal booking curves for each itinerary • Pricing and inventory decisions are data - driven and focused on staying on unique booking curve. Real - time analysis by ship and by cabin category. • Open voyages for sale earlier to elongate the booking window • Robust systems in place to upsell inventory to booked guests in order to maximize revenue – similar to airline purchased upgrades • Itinerary optimization strategies move ship assets to premium markets to hit peak seasons • Integrated air and cruise bundle drives yields by increasing accessibility - expanding guest source markets and making more premium itineraries available to existing source markets Focus on managing to each sailings’ unique optimum booking curve to drive higher pricing 171 225 245 Q3 2016 Q3 2019 Q3 2022 Booking Window Expansion (Days)
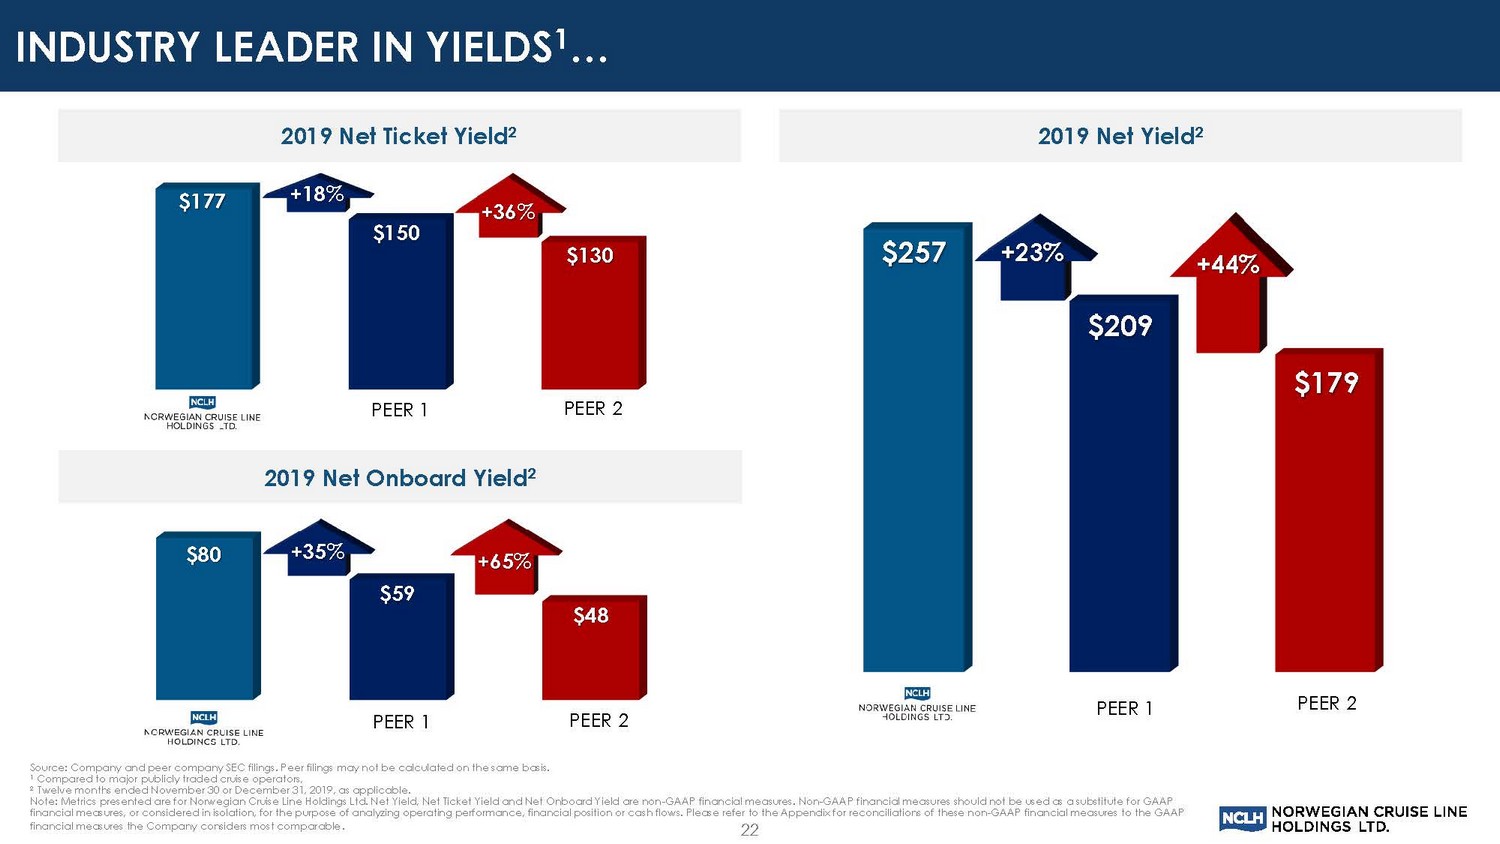
$80 $59 $48 2019 Net Ticket Yield 2 2019 Net Yield 2 2019 Net Onboard Yield 2 $177 $150 $130 +35% +65% +18% +36% $257 $209 $179 PEER 1 PEER 2 +23% +44% Source: Company and peer company SEC filings. Peer filings may not be calculated on the same basis. 1 Compared to major publicly traded cruise operators, 2 Twelve months ended November 30 or December 31, 2019, as applicable. Note: Metrics presented are for Norwegian Cruise Line Holdings Ltd. Net Yield, Net Ticket Yield and Net Onboard Yield are non - GA AP financial measures. Non - GAAP financial measures should not be used as a substitute for GAAP financial measures, or considered in isolation, for the purpose of analyzing operating performance, financial position or cas h f lows. Please refer to the Appendix for reconciliations of these non - GAAP financial measures to the GAAP financial measures the Company considers most comparable . PEER 1 PEER 1 PEER 2 PEER 2 22 INDUSTRY LEADER IN YIELDS 1 …
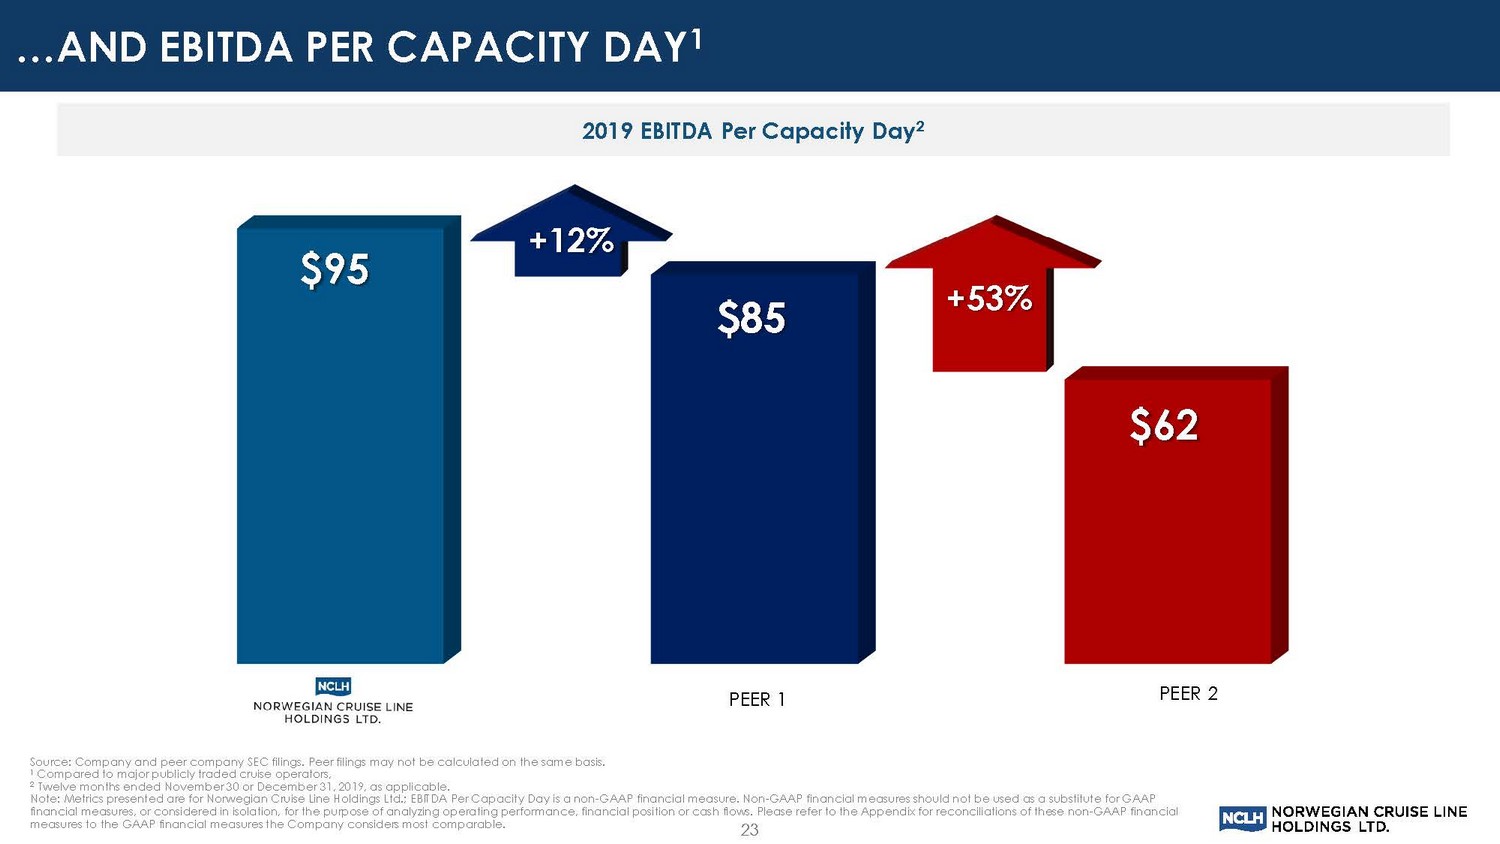
2019 EBITDA Per Capacity Day 2 $95 $85 $62 +12% +53% Source: Company and peer company SEC filings. Peer filings may not be calculated on the same basis. 1 Compared to major publicly traded cruise operators, 2 Twelve months ended November 30 or December 31, 2019, as applicable. Note: Metrics presented are for Norwegian Cruise Line Holdings Ltd.; EBITDA Per Capacity Day is a non - GAAP financial measure. No n - GAAP financial measures should not be used as a substitute for GAAP financial measures, or considered in isolation, for the purpose of analyzing operating performance, financial position or cas h f lows. Please refer to the Appendix for reconciliations of these non - GAAP financial measures to the GAAP financial measures the Company considers most comparable. PEER 1 PEER 2 23 …AND EBITDA PER CAPACITY DAY 1
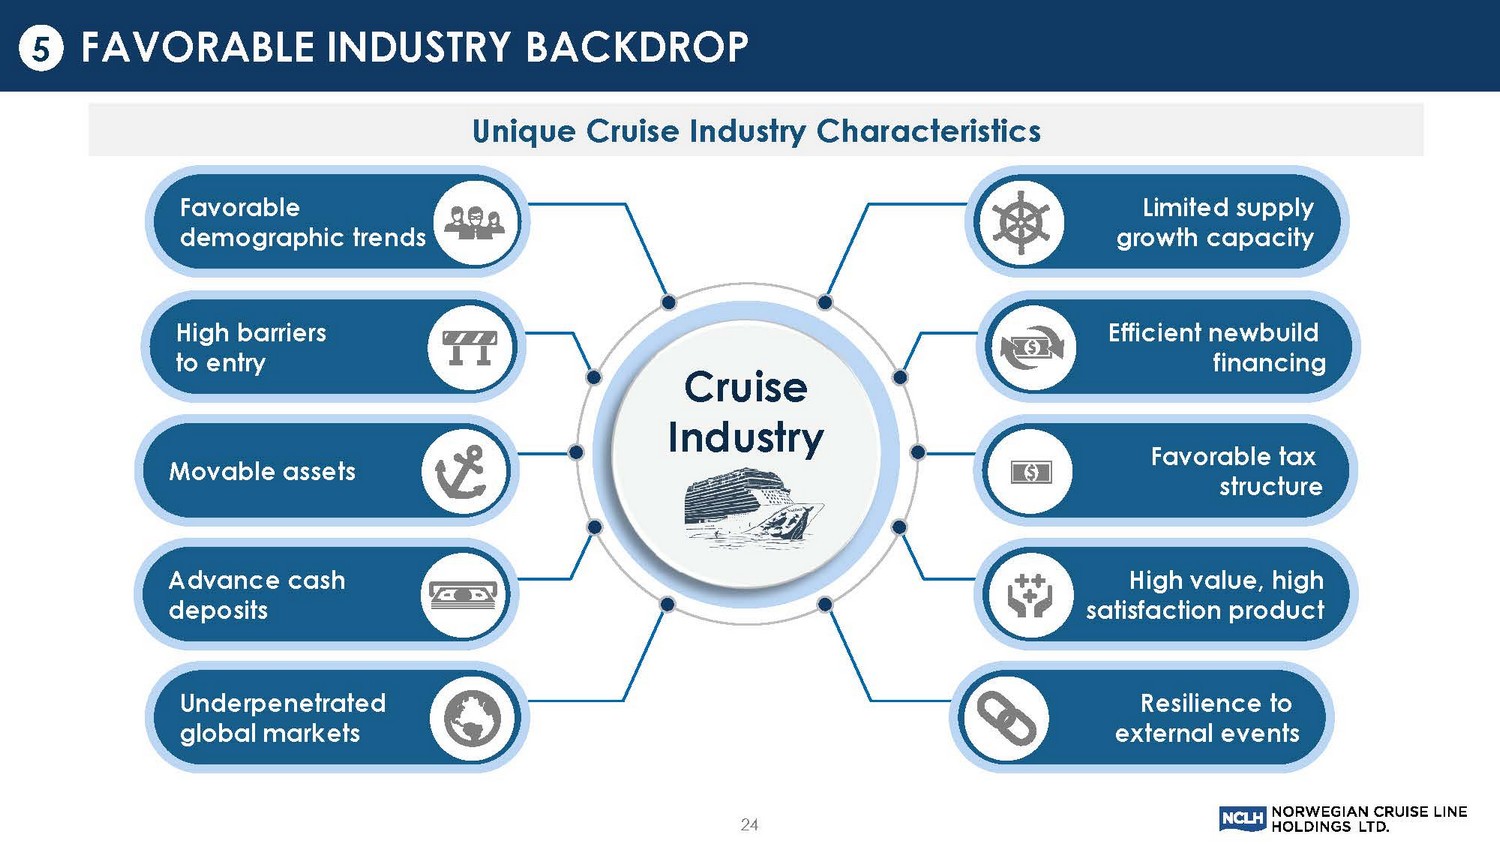
Efficient newbuild financing 24 Cruise Industry Limited supply growth capacity High value, high satisfaction product Resilience to external events Movable assets Advance cash deposits High barriers to entry Favorable demographic trends Favorable tax structure Underpenetrated global markets Unique Cruise Industry Characteristics FAVORABLE INDUSTRY BACKDROP 5
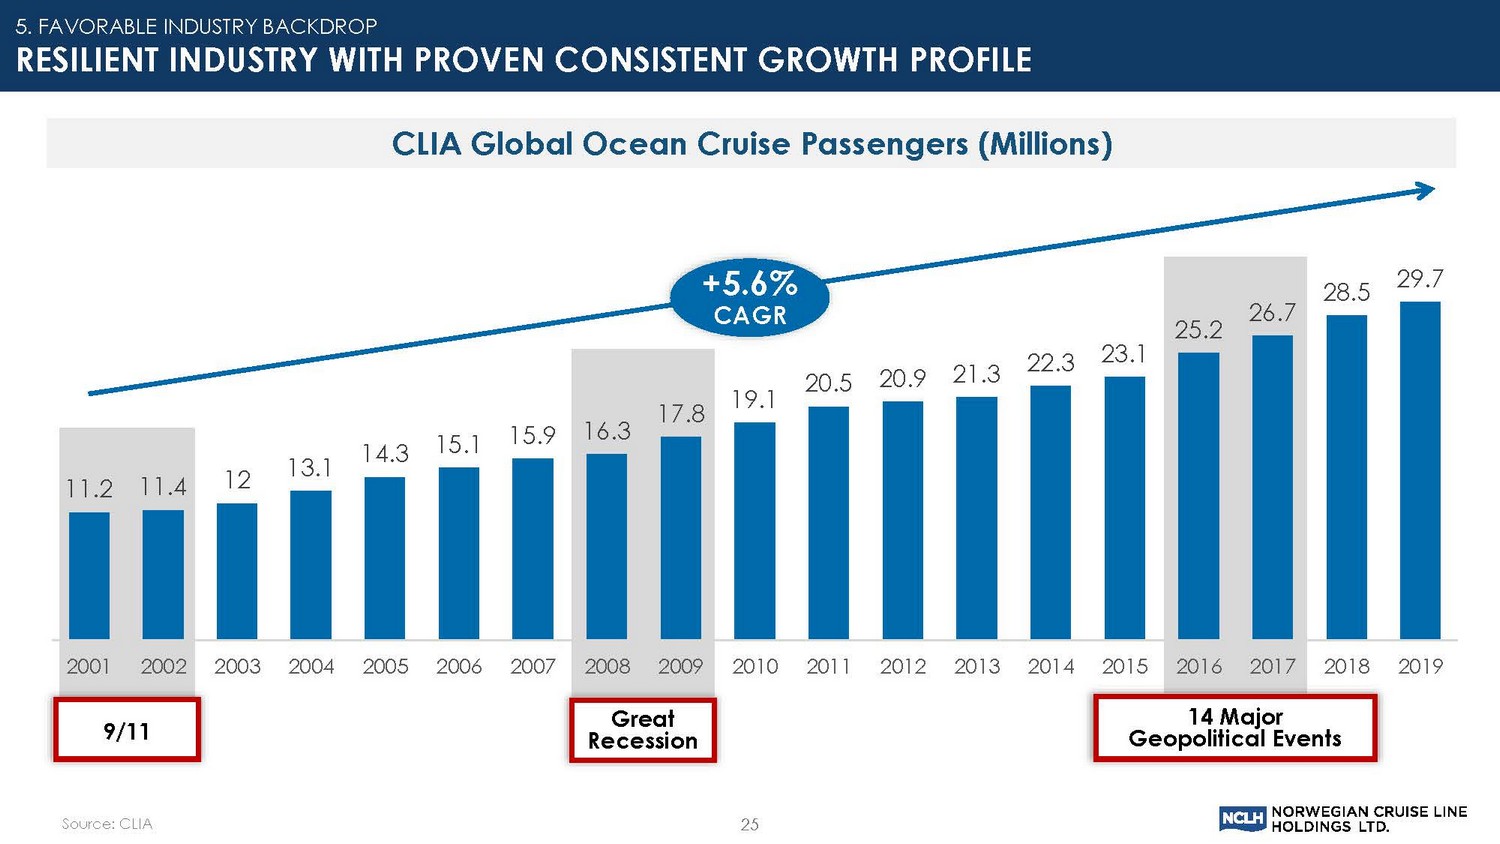
Source: CLIA 25 CLIA Global Ocean Cruise Passengers (Millions) 9/11 +5.6% CAGR Great Recession 14 Major Geopolitical Events 5. FAVORABLE INDUSTRY BACKDROP RESILIENT INDUSTRY WITH PROVEN CONSISTENT GROWTH PROFILE 11.2 11.4 12 13.1 14.3 15.1 15.9 16.3 17.8 19.1 20.5 20.9 21.3 22.3 23.1 25.2 26.7 28.5 29.7 2001 2002 2003 2004 2005 2006 2007 2008 2009 2010 2011 2012 2013 2014 2015 2016 2017 2018 2019
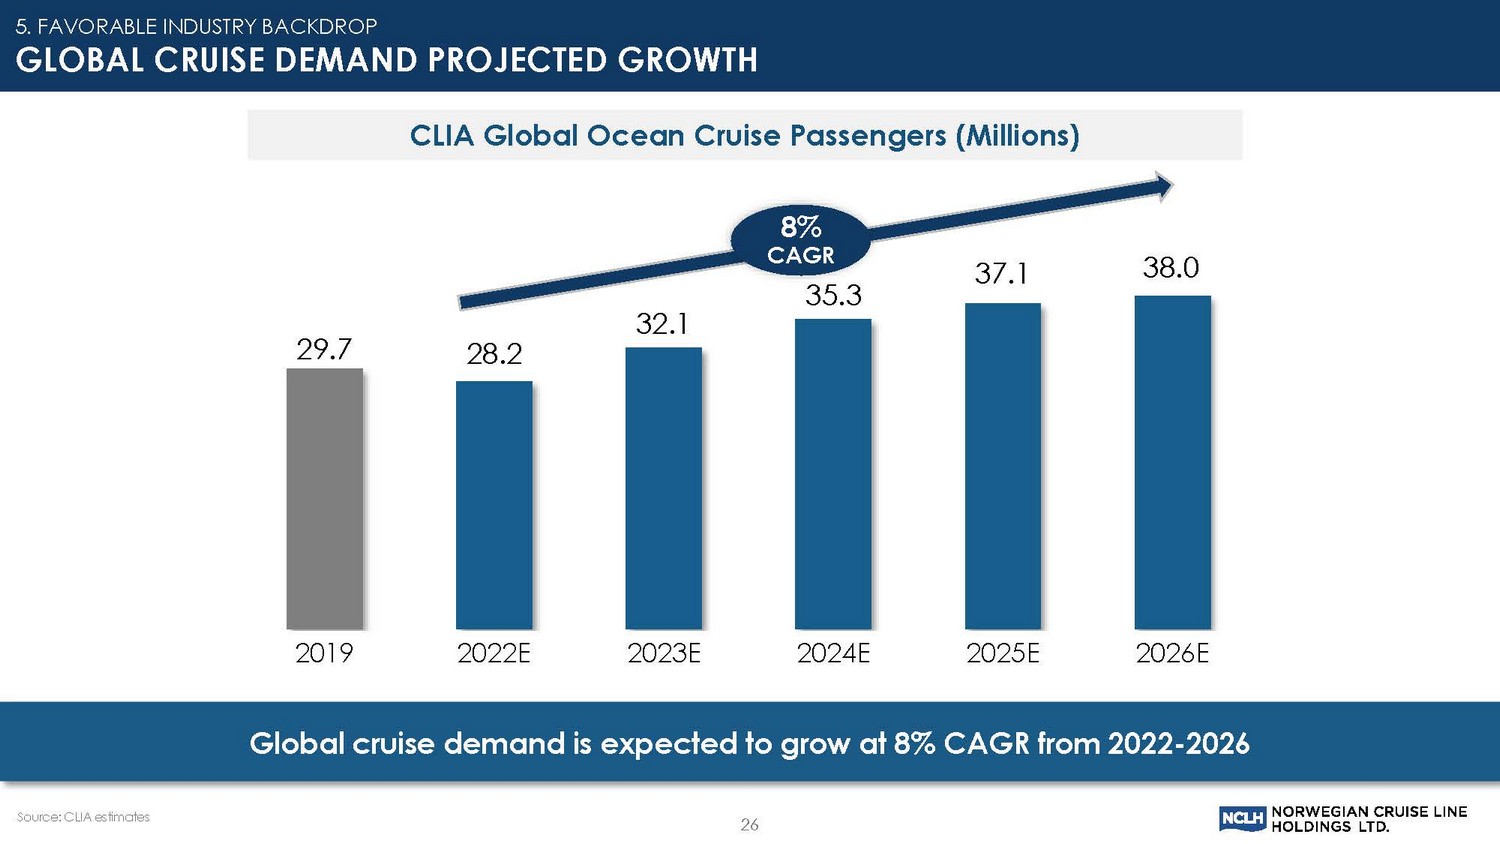
29.7 28.2 32.1 35.3 37.1 38.0 2019 2022E 2023E 2024E 2025E 2026E Source: CLIA estimates Global cruise demand is expected to grow at 8% CAGR from 2022 - 2026 26 8% CAGR 5. FAVORABLE INDUSTRY BACKDROP GLOBAL CRUISE DEMAND PROJECTED GROWTH CLIA Global Ocean Cruise Passengers (Millions)
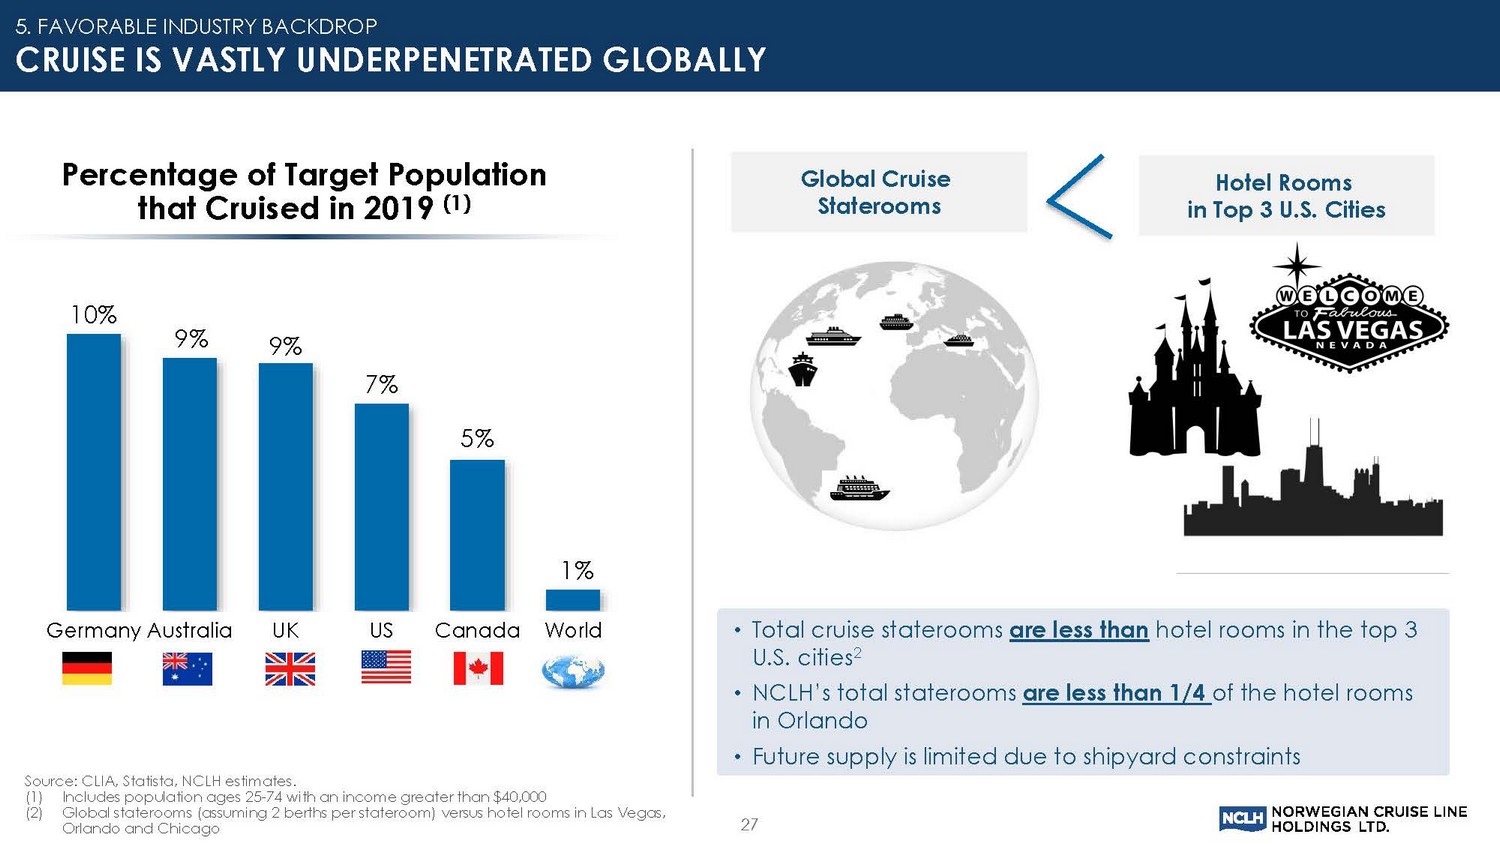
27 Percentage of Target Population that Cruised in 2019 (1) 10% 9% 9% 7% 5% 1% Germany Australia UK US Canada World Source: CLIA, Statista, NCLH estimates. (1) Includes population ages 25 - 74 with an income greater than $40,000 (2) Global staterooms (assuming 2 berths per stateroom) versus hotel rooms in Las Vegas, Orlando and Chicago 5. FAVORABLE INDUSTRY BACKDROP CRUISE IS VASTLY UNDERPENETRATED GLOBALLY • Total cruise staterooms are less than hotel rooms in the top 3 U.S. cities 2 • NCLH’s total staterooms are less than 1/4 of the hotel rooms in Orlando • Future supply is limited due to shipyard constraints Global Cruise Staterooms Hotel Rooms in Top 3 U.S. Cities
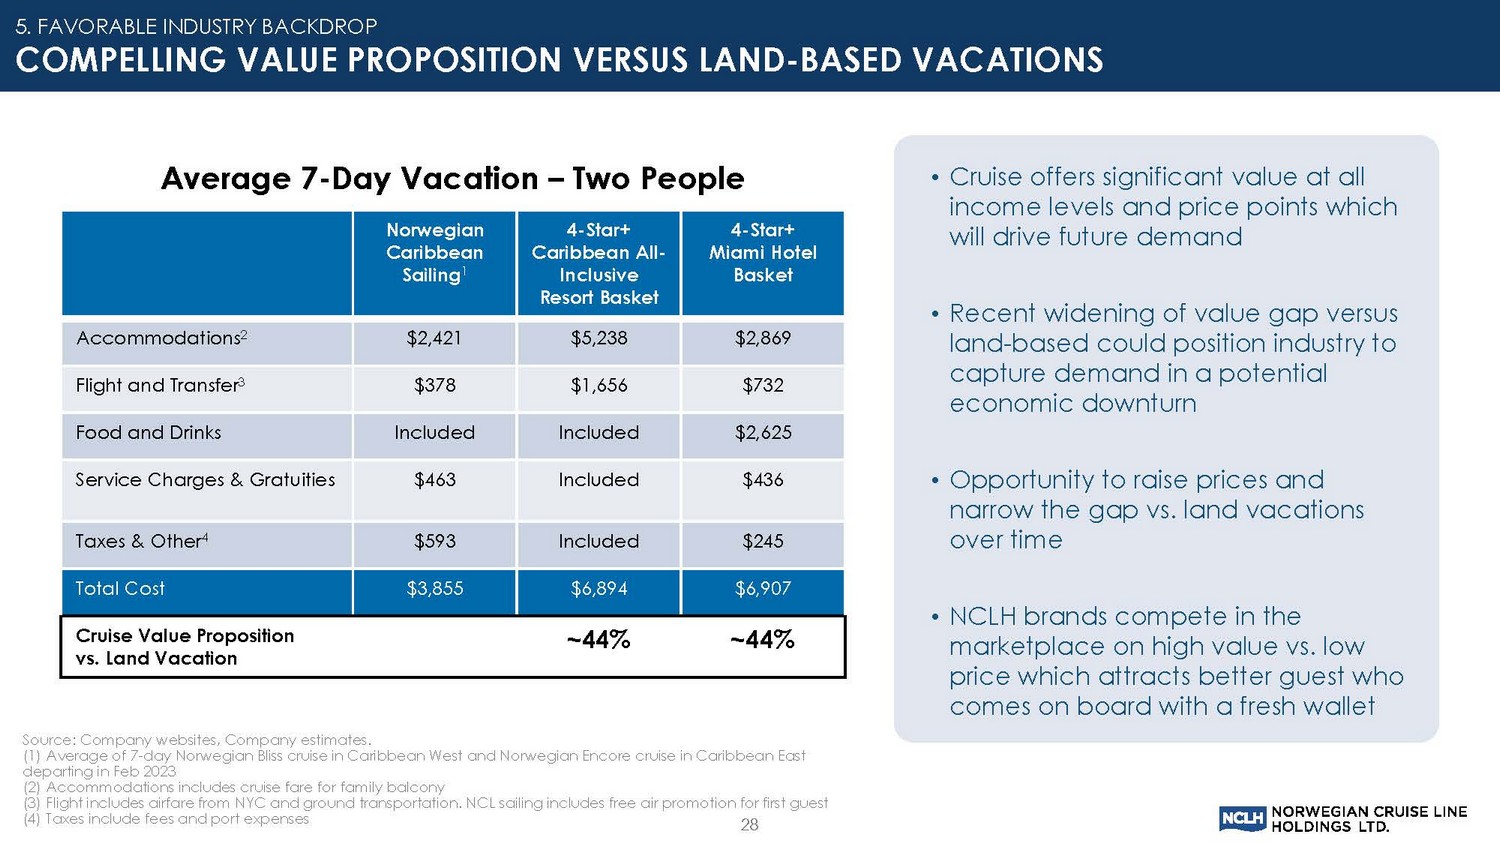
28 • Cruise offers significant value at all income levels and price points which will drive future demand • Recent widening of value gap versus land - based could position industry to capture demand in a potential economic downturn • Opportunity to raise prices and narrow the gap vs. land vacations over time • NCLH brands compete in the marketplace on high value vs. low price which attracts better guest who comes on board with a fresh wallet 5. FAVORABLE INDUSTRY BACKDROP COMPELLING VALUE PROPOSITION VERSUS LAND - BASED VACATIONS Average 7 - Day Vacation – Two People Source: Company websites, Company estimates. (1) Average of 7 - day Norwegian Bliss cruise in Caribbean West and Norwegian Encore cruise in Caribbean East departing in Feb 2023 (2) Accommodations includes cruise fare for family balcony (3) Flight includes airfare from NYC and ground transportation. NCL sailing includes free air promotion for first guest (4) Taxes include fees and port expenses Norwegian Caribbean Sailing 1 4 - Star+ Caribbean All - Inclusive Resort Basket 4 - Star+ Miami Hotel Basket Accommodations 2 $2,421 $5,238 $2,869 Flight and Transfer 3 $378 $1,656 $732 Food and Drinks Included Included $2,625 Service Charges & Gratuities $463 Included $436 Taxes & Other 4 $593 Included $245 Total Cost $3,855 $6,894 $6,907 Cruise Value Proposition vs. Land Vacation ~44% ~44%
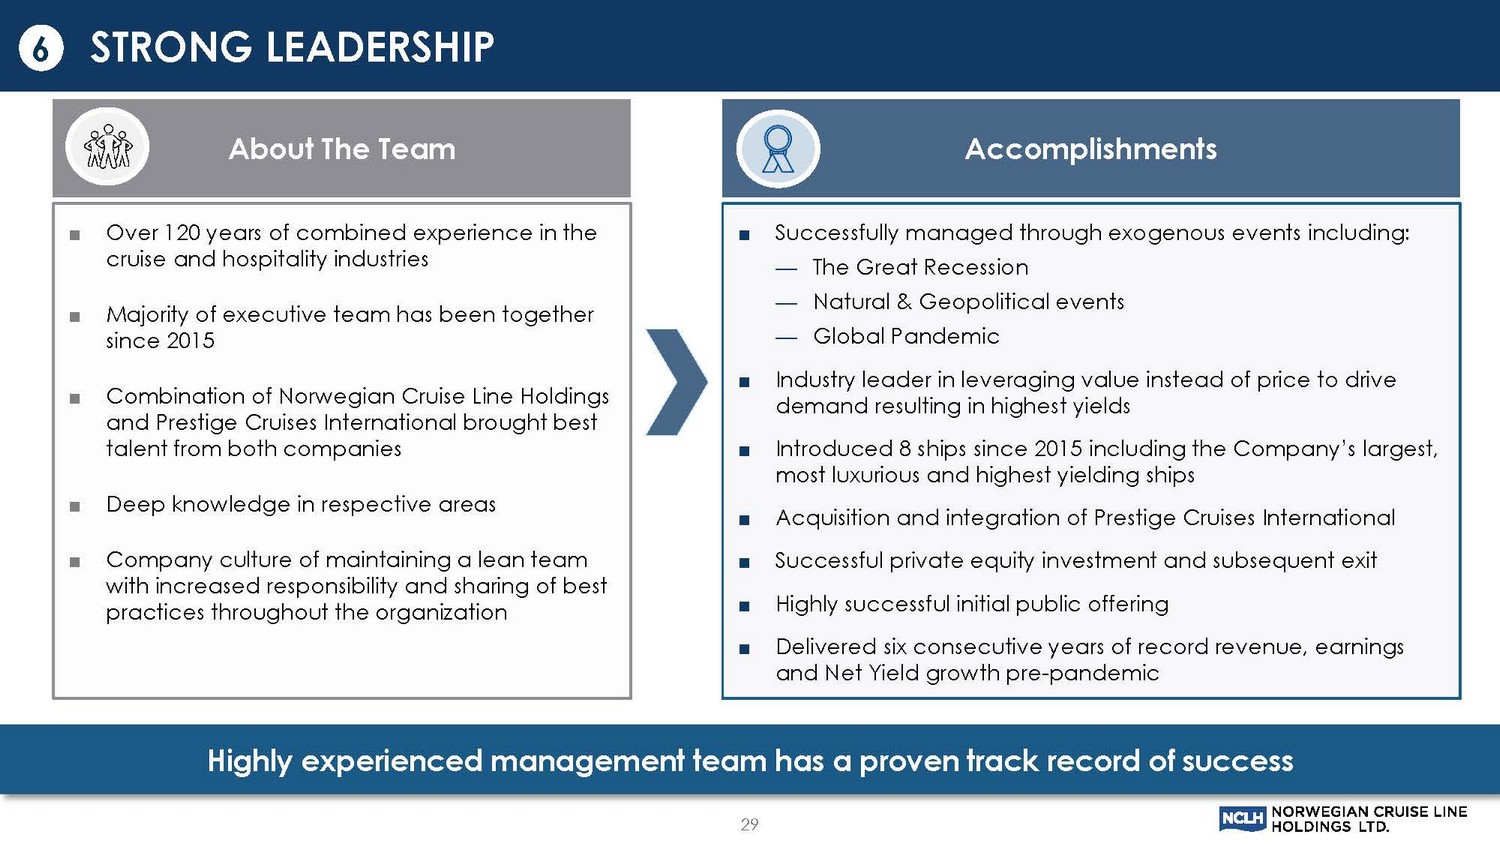
About The Team Accomplishments ■ Over 120 years of combined experience in the cruise and hospitality industries ■ Majority of executive team has been together since 2015 ■ Combination of Norwegian Cruise Line Holdings and Prestige Cruises International brought best talent from both companies ■ Deep knowledge in respective areas ■ Company culture of maintaining a lean team with increased responsibility and sharing of best practices throughout the organization ■ Successfully managed through exogenous events including: — The Great Recession — Natural & Geopolitical events — Global Pandemic ■ Industry leader in leveraging value instead of price to drive demand resulting in highest yields ■ Introduced 8 ships since 2015 including the Company’s largest, most luxurious and highest yielding ships ■ Acquisition and integration of Prestige Cruises International ■ Successful private equity investment and subsequent exit ■ Highly successful initial public offering ■ Delivered six consecutive years of record revenue, earnings and Net Yield growth pre - pandemic 29 Highly experienced management team has a proven track record of success STRONG LEADERSHIP 6
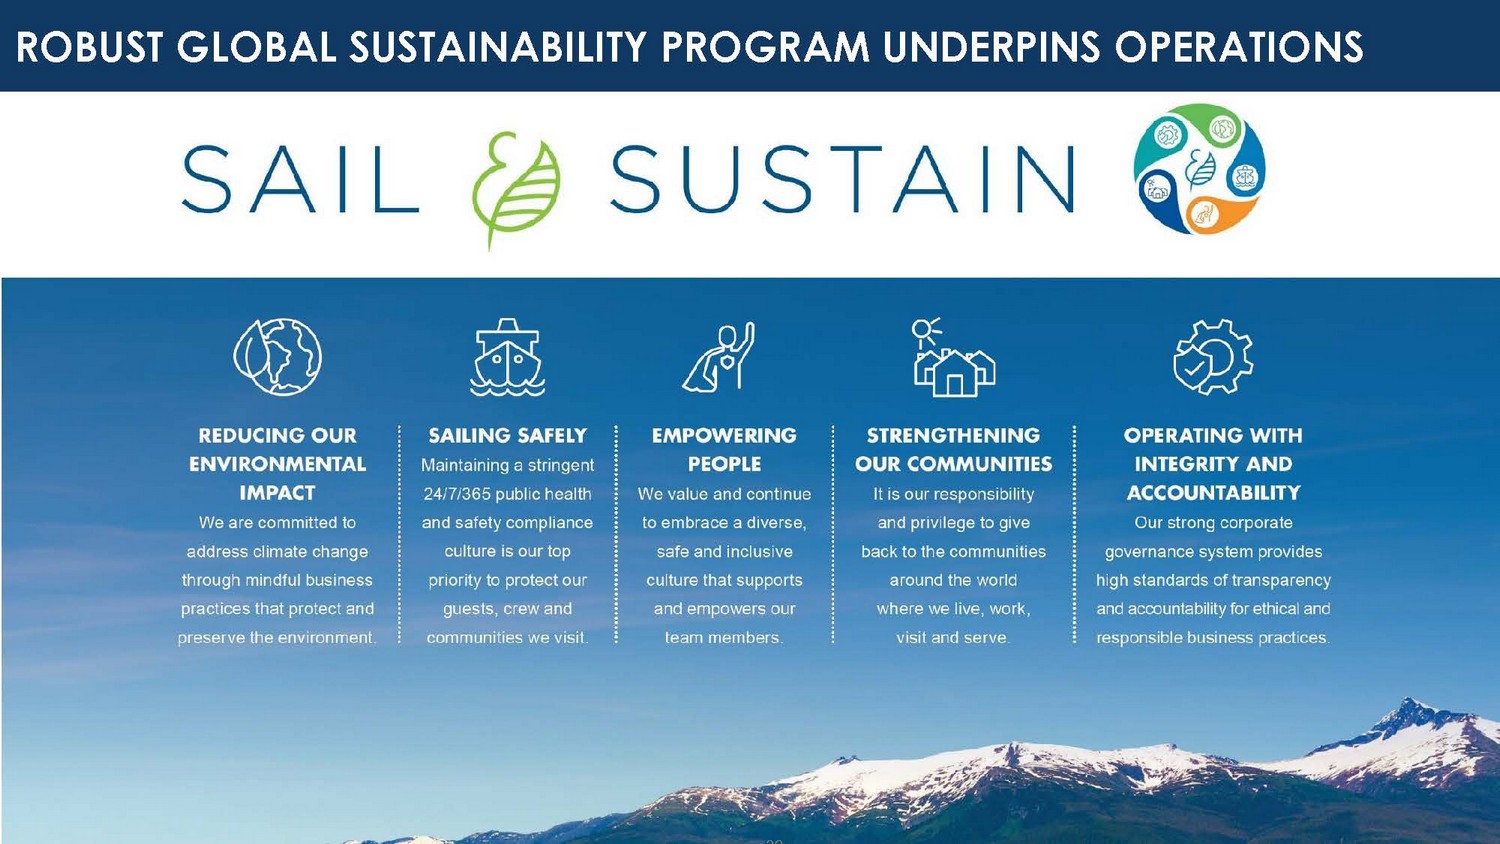
30 30 ROBUST GLOBAL SUSTAINABILITY PROGRAM UNDERPINS OPERATIONS
31 BUSINESS UPDATE
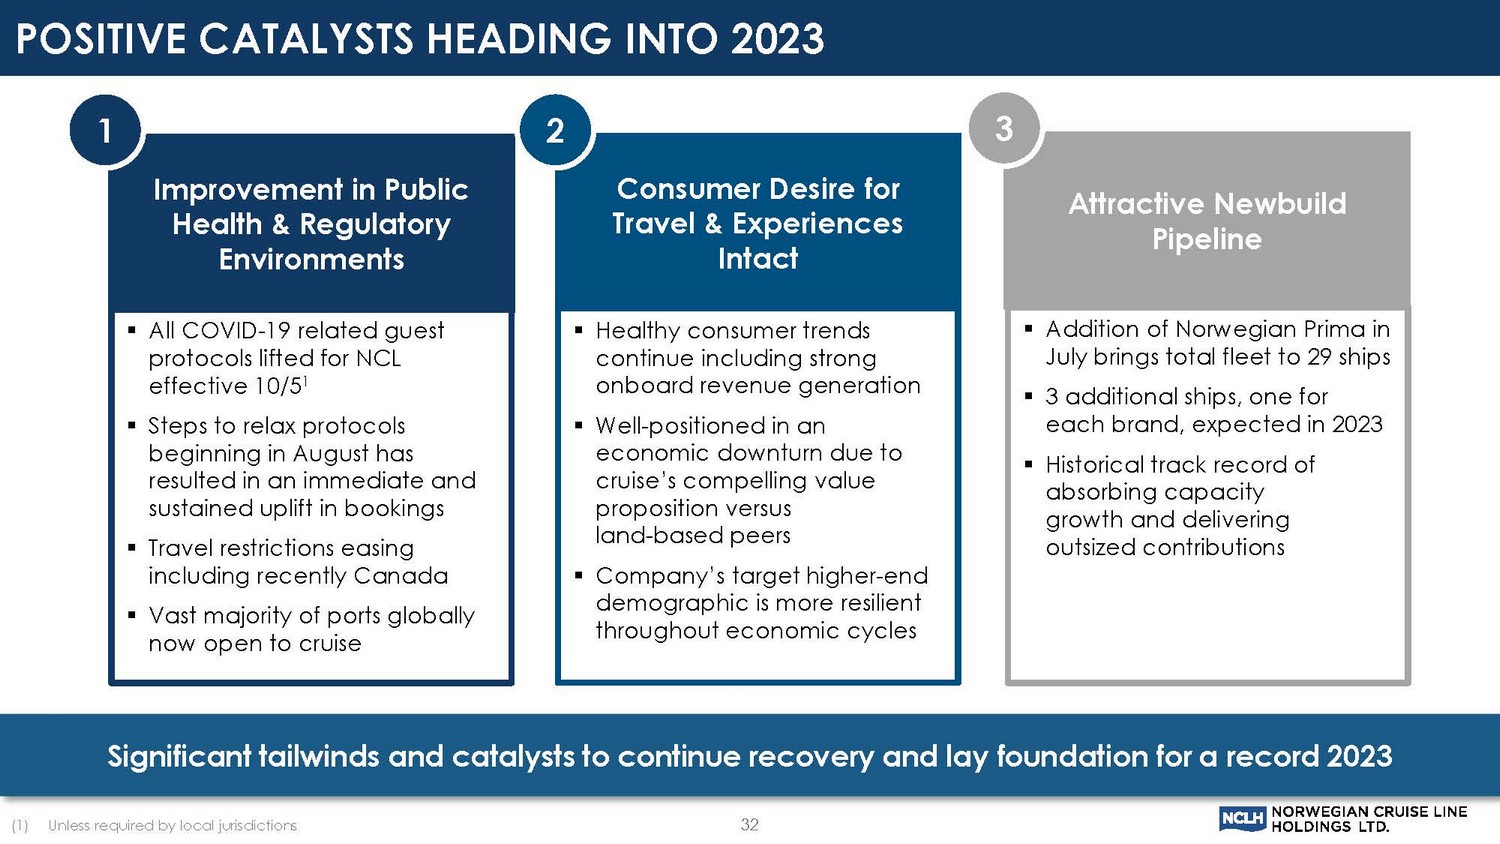
32 Significant tailwinds and catalysts to continue recovery and lay foundation for a record 2023 Improvement in Public Health & Regulatory Environments ▪ All COVID - 19 related guest protocols lifted for NCL effective 10/5 1 ▪ Steps to relax protocols beginning in August has resulted in an immediate and sustained uplift in bookings ▪ Travel restrictions easing including recently Canada ▪ Vast majority of ports globally now open to cruise 1 Consumer Desire for Travel & Experiences Intact ▪ Healthy consumer trends continue including strong onboard revenue generation ▪ Well - positioned in an economic downturn due to cruise’s compelling value proposition versus land - based peers ▪ Company’s target higher - end demographic is more resilient throughout economic cycles 2 Attractive Newbuild Pipeline ▪ Addition of Norwegian Prima in July brings total fleet to 29 ships ▪ 3 additional ships, one for each brand, expected in 2023 ▪ Historical track record of absorbing capacity growth and delivering outsized contributions 3 POSITIVE CATALYSTS HEADING INTO 2023 (1) Unless required by local jurisdictions
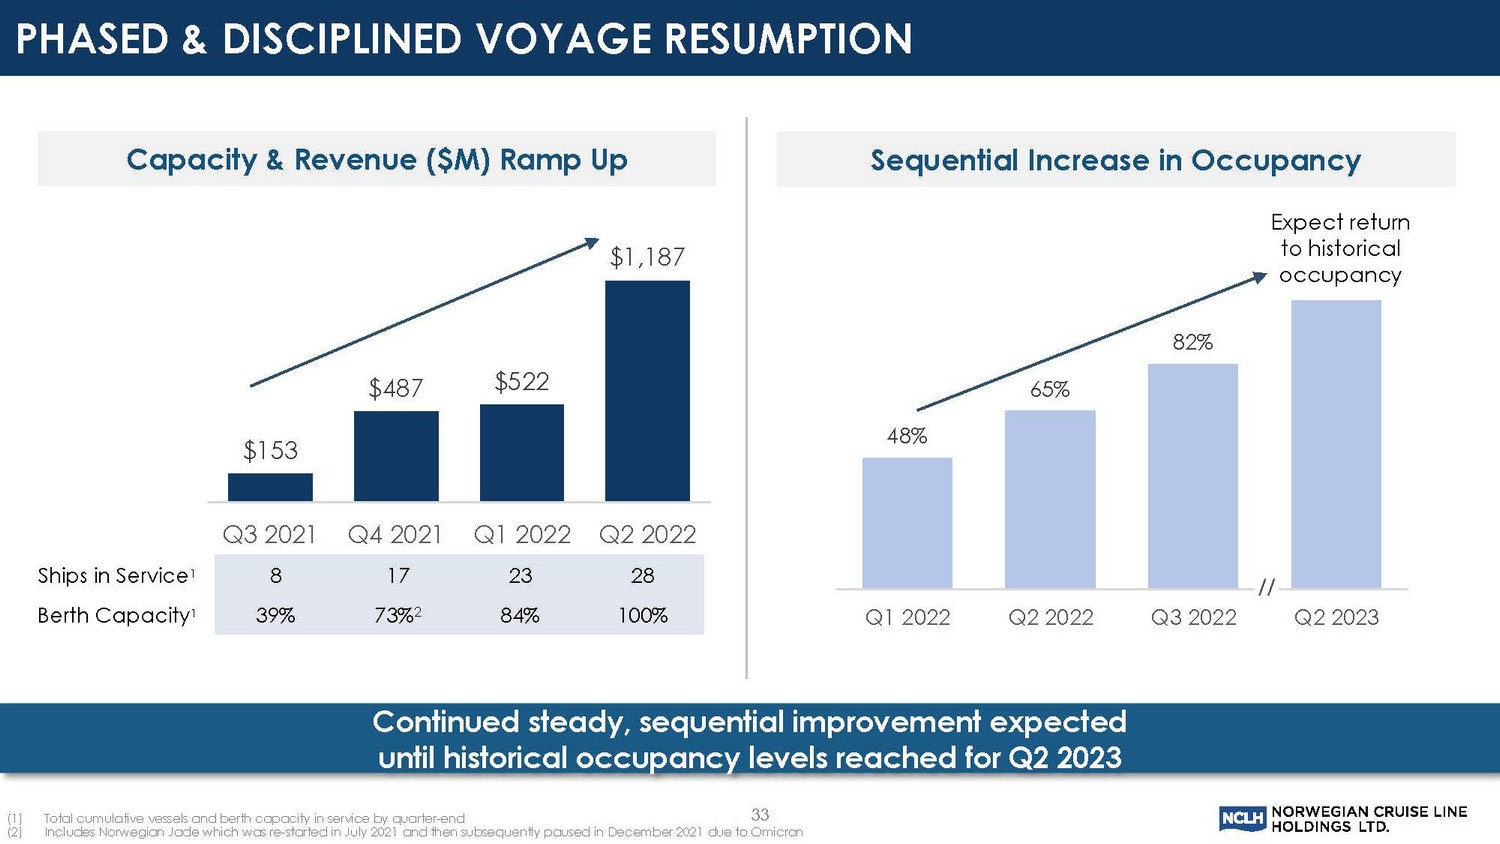
PHASED & DISCIPLINED VOYAGE RESUMPTION (1) Total cumulative vessels and berth capacity in service by quarter - end (2) Includes Norwegian Jade which was re - started in July 2021 and then subsequently paused in December 2021 due to Omicron 33 Continued steady, sequential improvement expected until historical occupancy levels reached for Q2 2023 Capacity & Revenue ($M) Ramp Up 8 17 23 28 39% 73% 2 84% 100% Ships in Service 1 Berth Capacity 1 Sequential Increase in Occupancy 48% 65% 82% Q1 2022 Q2 2022 Q3 2022 Q2 2023 Expect return to historical occupancy $153 $487 $522 $1,187 Q3 2021 Q4 2021 Q1 2022 Q2 2022
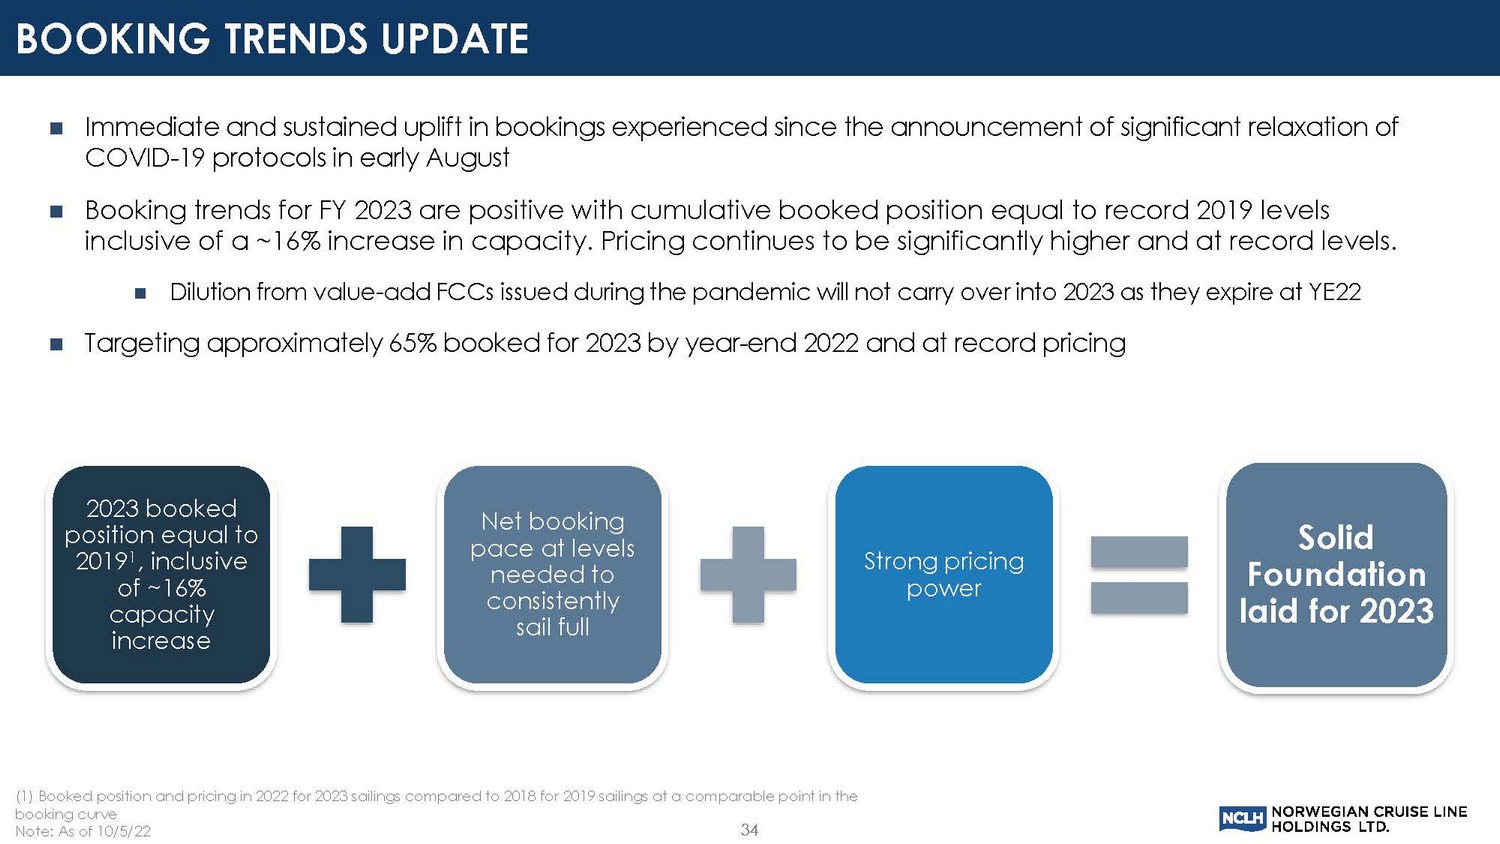
Immediate and sustained uplift in bookings experienced since the announcement of significant relaxation of COVID - 19 protocols in early August Booking trends for FY 2023 are positive with cumulative booked position equal to record 2019 levels inclusive of a ~16% increase in capacity. Pricing continues to be significantly higher and at record levels. Dilution from value - add FCCs issued during the pandemic will not carry over into 2023 as they expire at YE22 Targeting approximately 65% booked for 2023 by year - end 2022 and at record pricing 34 2023 booked position equal to 2019 1 , inclusive of ~16% capacity increase Net booking pace at levels needed to consistently sail full Strong pricing power Solid Foundation laid for 2023 (1) Booked position and pricing in 2022 for 2023 sailings compared to 2018 for 2019 sailings at a comparable point in the booking curve Note: As of 10/5/22 BOOKING TRENDS UPDATE
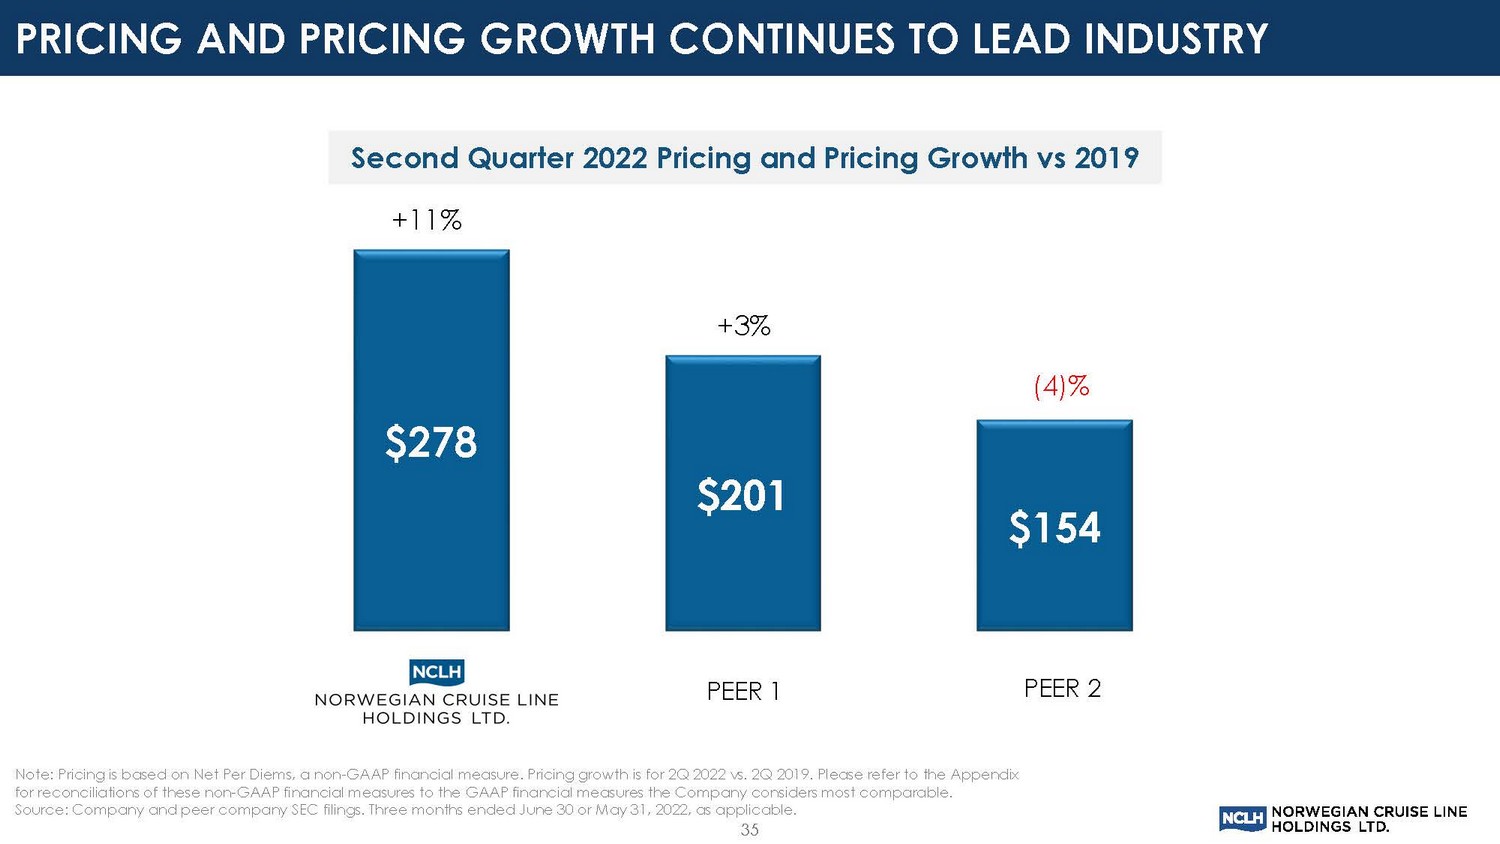
$278 $201 $154 +11% +3% (4)% Second Quarter 2022 Pricing and Pricing Growth vs 2019 Note: Pricing is based on Net Per Diems, a non - GAAP financial measure. Pricing growth is for 2Q 2022 vs. 2Q 2019. Please refer t o the Appendix for reconciliations of these non - GAAP financial measures to the GAAP financial measures the Company considers most comparable. Source: Company and peer company SEC filings. Three months ended June 30 or May 31, 2022, as applicable. 35 PEER 1 PEER 2 PRICING AND PRICING GROWTH CONTINUES TO LEAD INDUSTRY
36 FINANCIAL UPDATE & OUTLOOK
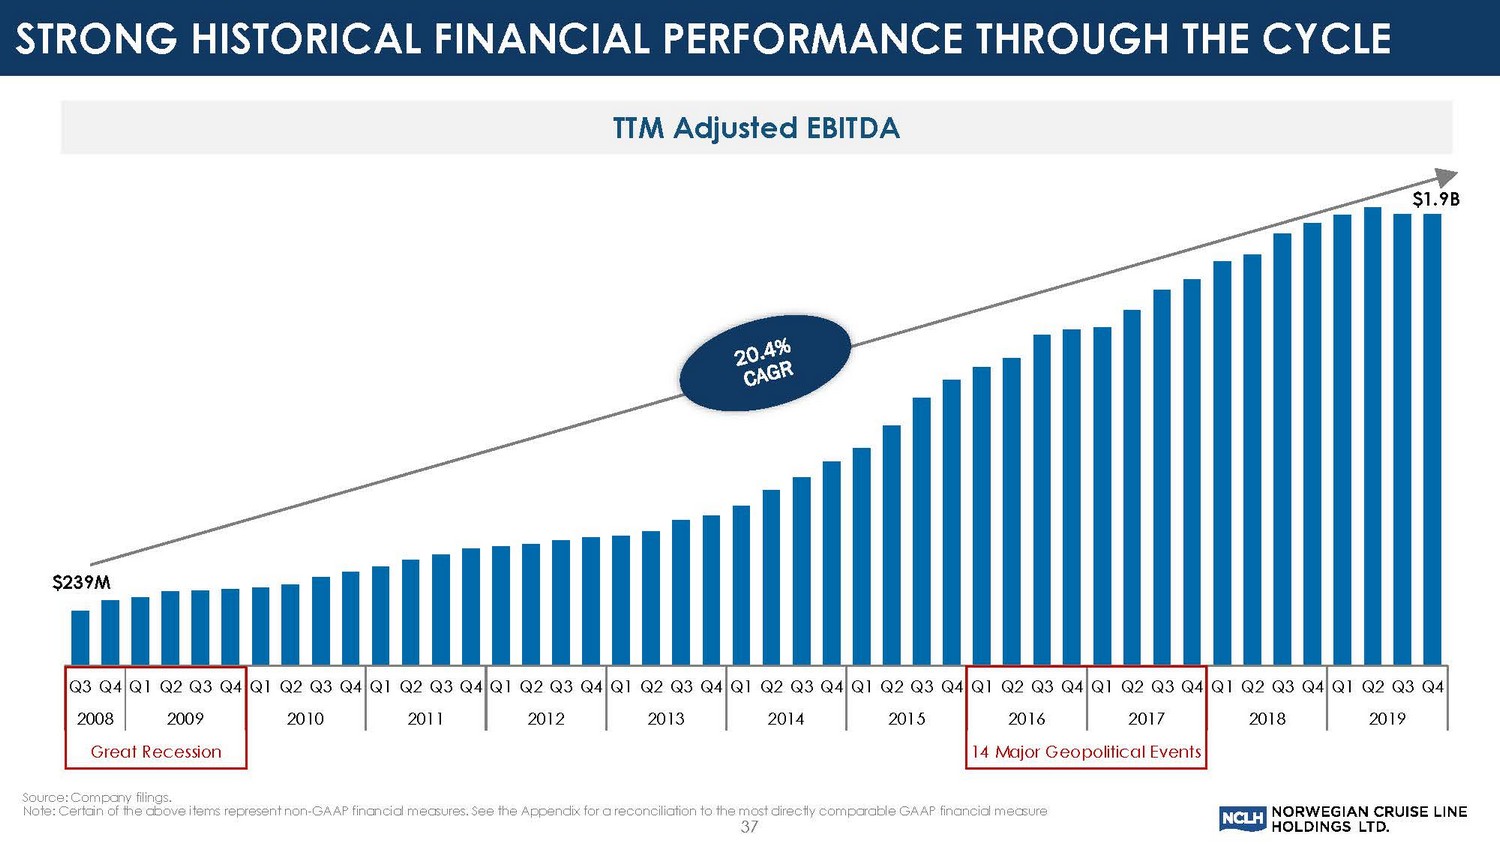
$239M $1.9B Source: Company filings. Note: Certain of the above items represent non - GAAP financial measures. See the Appendix for a reconciliation to the most directly comparable GAAP financial measure Q3 Q4 Q1 Q2 Q3 Q4 Q1 Q2 Q3 Q4 Q1 Q2 Q3 Q4 Q1 Q2 Q3 Q4 Q1 Q2 Q3 Q4 Q1 Q2 Q3 Q4 Q1 Q2 Q3 Q4 Q1 Q2 Q3 Q4 Q1 Q2 Q3 Q4 Q1 Q2 Q3 Q4 Q1 Q2 Q3 Q4 2008 2009 2010 2011 2012 2013 2014 2015 2016 2017 2018 2019 Great Recession 14 Major Geopolitical Events 37 TTM Adjusted EBITDA STRONG HISTORICAL FINANCIAL PERFORMANCE THROUGH THE CYCLE
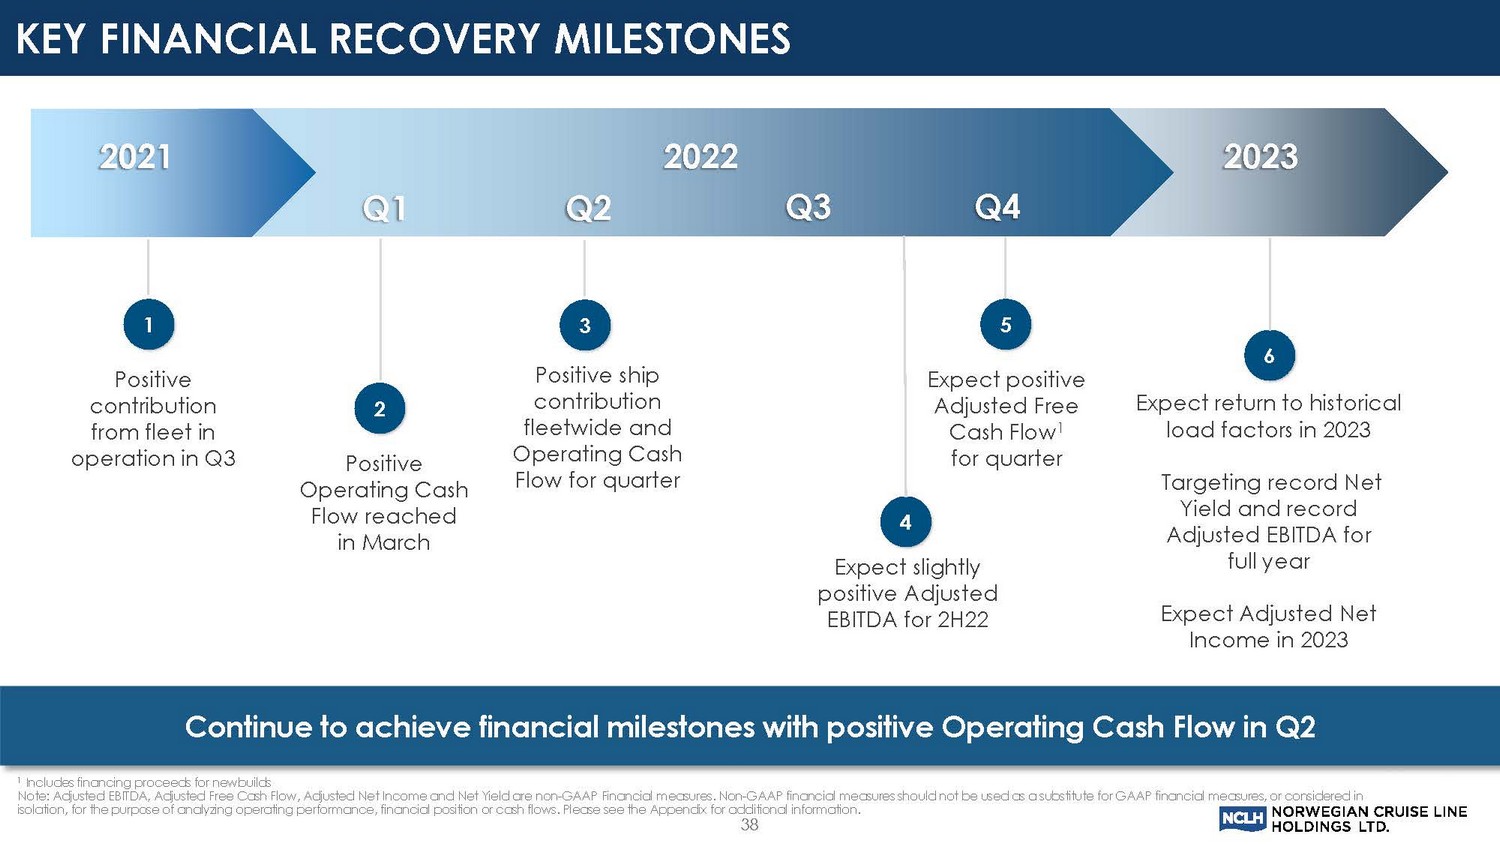
Positive contribution from fleet in operation in Q3 1 2023 2021 Q1 Q2 Q3 Q4 2022 Positive Operating Cash Flow reached in March 2 Positive ship contribution fleetwide and Operating Cash Flow for quarter 3 Expect slightly positive Adjusted EBITDA for 2H22 4 Expect positive Adjusted Free Cash Flow 1 for quarter 5 Expect return to historical load factors in 2023 Targeting record Net Yield and record Adjusted EBITDA for full year Expect Adjusted Net Income in 2023 6 1 Includes financing proceeds for newbuilds Note: Adjusted EBITDA, Adjusted Free Cash Flow, Adjusted Net Income and Net Yield are non - GAAP Financial measures. Non - GAAP fina ncial measures should not be used as a substitute for GAAP financial measures, or considered in isolation, for the purpose of analyzing operating performance, financial position or cash flows. Please see the Appendix for add itional information. Continue to achieve financial milestones with positive Operating Cash Flow in Q2 38 KEY FINANCIAL RECOVERY MILESTONES
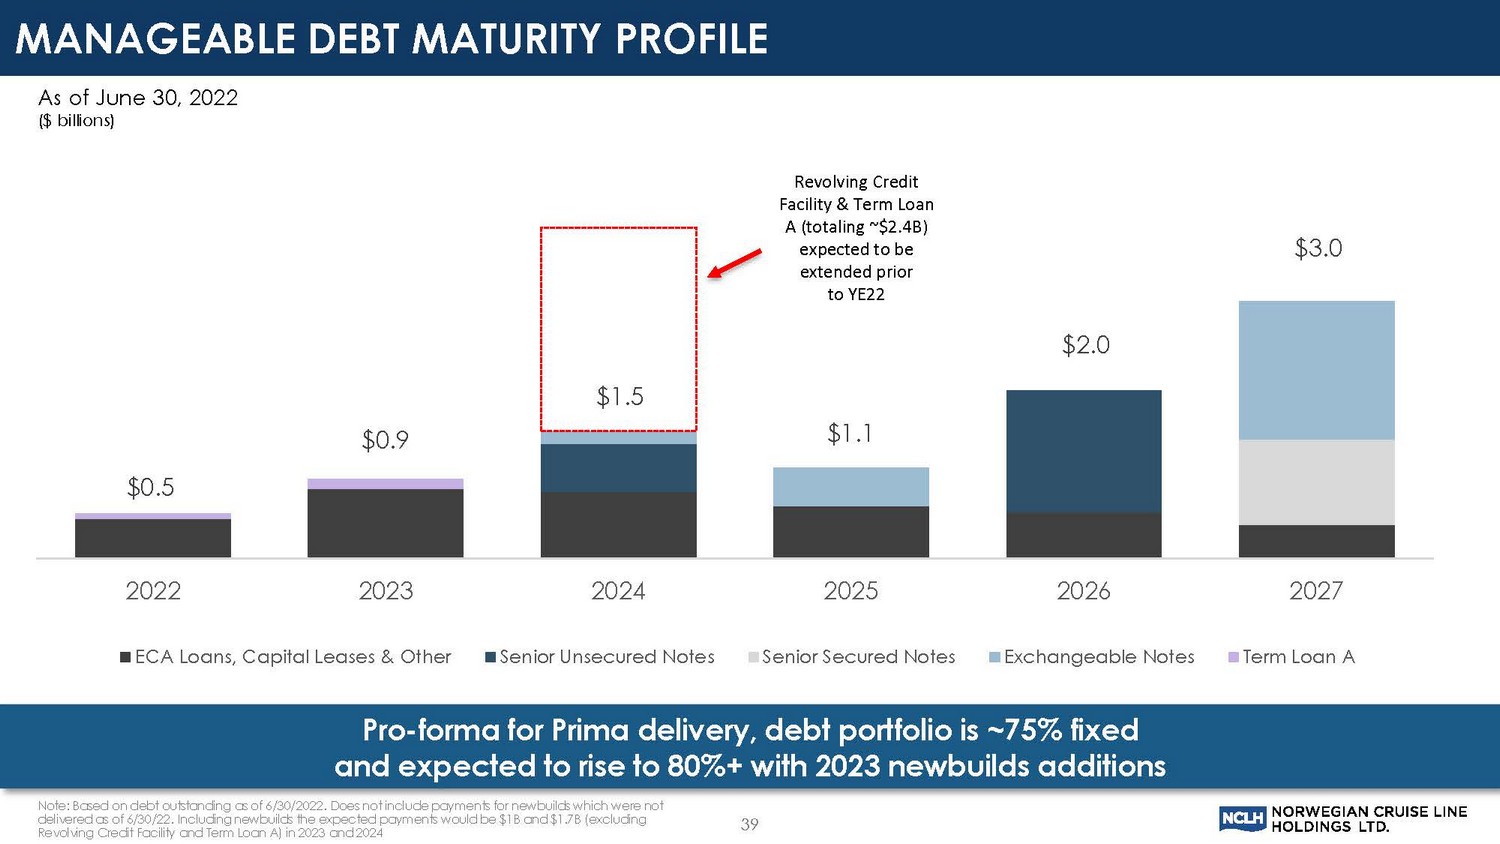
Note: Based on debt outstanding as of 6/30/2022. Does not include payments for newbuilds which were not delivered as of 6/30/22. Including newbuilds the expected payments would be $1B and $1.7B (excluding Revolving Credit Facility and Term Loan A) in 2023 and 2024 39 As of June 30, 2022 ($ billions) Pro - forma for Prima delivery, debt portfolio is ~75% fixed and expected to rise to 80%+ with 2023 newbuilds additions $0.5 $0.9 $1.5 $1.1 $2.0 $3.0 2022 2023 2024 2025 2026 2027 ECA Loans, Capital Leases & Other Senior Unsecured Notes Senior Secured Notes Exchangeable Notes Term Loan A Revolving Credit Facility & Term Loan A (totaling ~$2.4B) expected to be extended prior to YE22 MANAGEABLE DEBT MATURITY PROFILE
1 Based on our outlook, we believe we can fund our operations with existing cash and organic cash flow generation 2 40 Liquidity of ~$2.2B as of September 30, 2022, consisting of $1.2B 1 of cash and cash equivalents and a $1B undrawn commitment Currently have ~$500M of incremental unsecured debt capacity available Expected to complete an amendment and extension of our operating credit facility maturing in 2024 by year - end 2022 Consists of $875M senior secured revolving credit facility and $1.5B Term Loan A (1) Cash and cash equivalents as of 9/30/22 is preliminary and is subject to revision as we prepare our financial statements and dis closures as of and for the three and nine months ended 9/30/22, and such revisions may be significant. (2) Assumes $1B undrawn commitment will be extended or replaced. LIQUIDITY POSITION
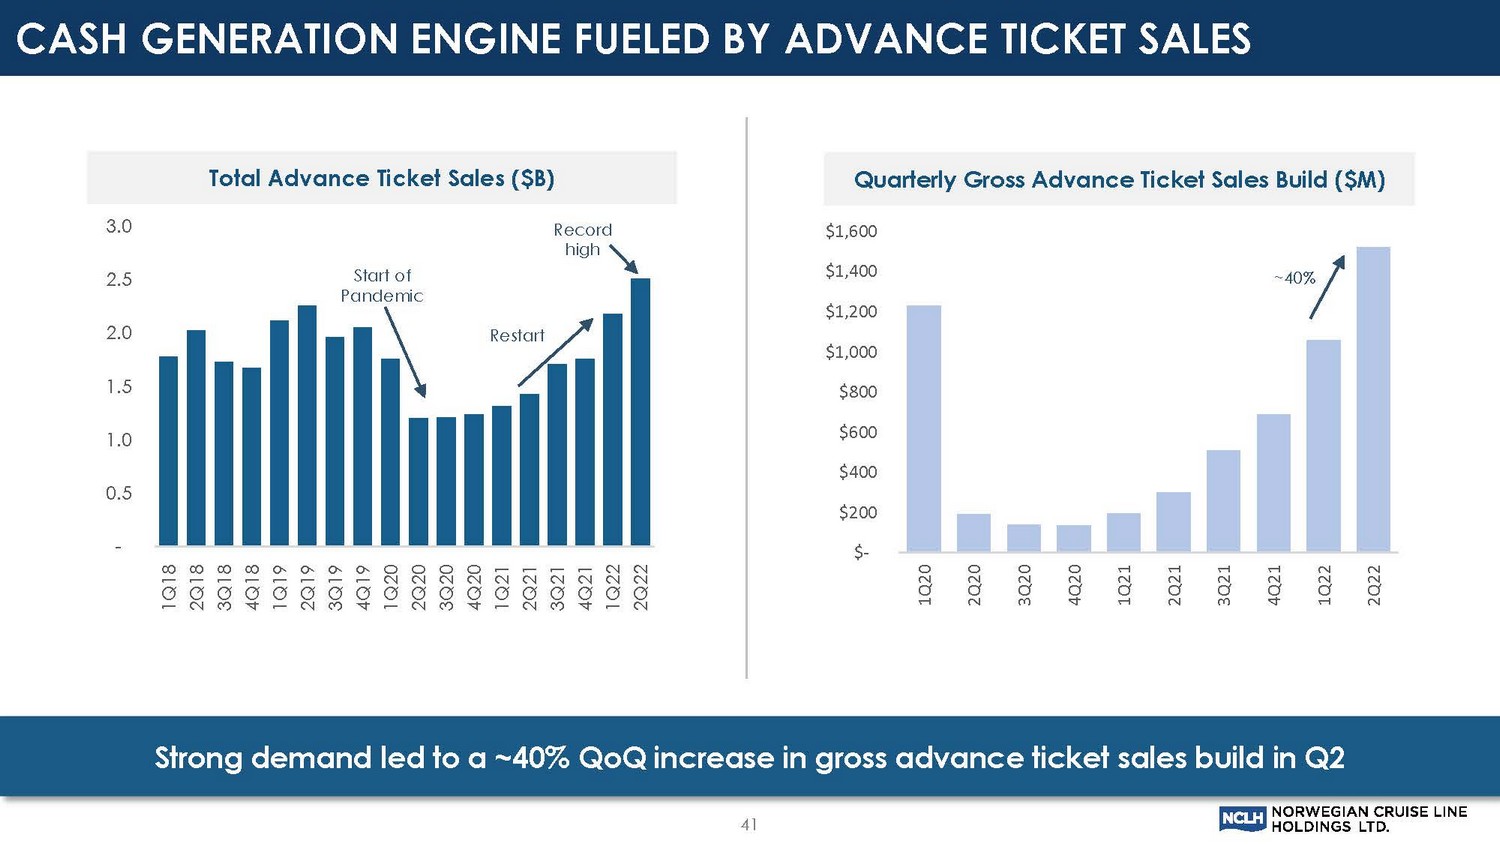
$- $200 $400 $600 $800 $1,000 $1,200 $1,400 $1,600 1Q20 2Q20 3Q20 4Q20 1Q21 2Q21 3Q21 4Q21 1Q22 2Q22 Strong demand led to a ~40% QoQ increase in gross advance ticket sales build in Q2 - 0.5 1.0 1.5 2.0 2.5 3.0 1Q18 2Q18 3Q18 4Q18 1Q19 2Q19 3Q19 4Q19 1Q20 2Q20 3Q20 4Q20 1Q21 2Q21 3Q21 4Q21 1Q22 2Q22 Start of Pandemic Restart Total Advance Ticket Sales ($B) Quarterly Gross Advance Ticket Sales Build ($M) ~40% 41 Record high CASH GENERATION ENGINE FUELED BY ADVANCE TICKET SALES
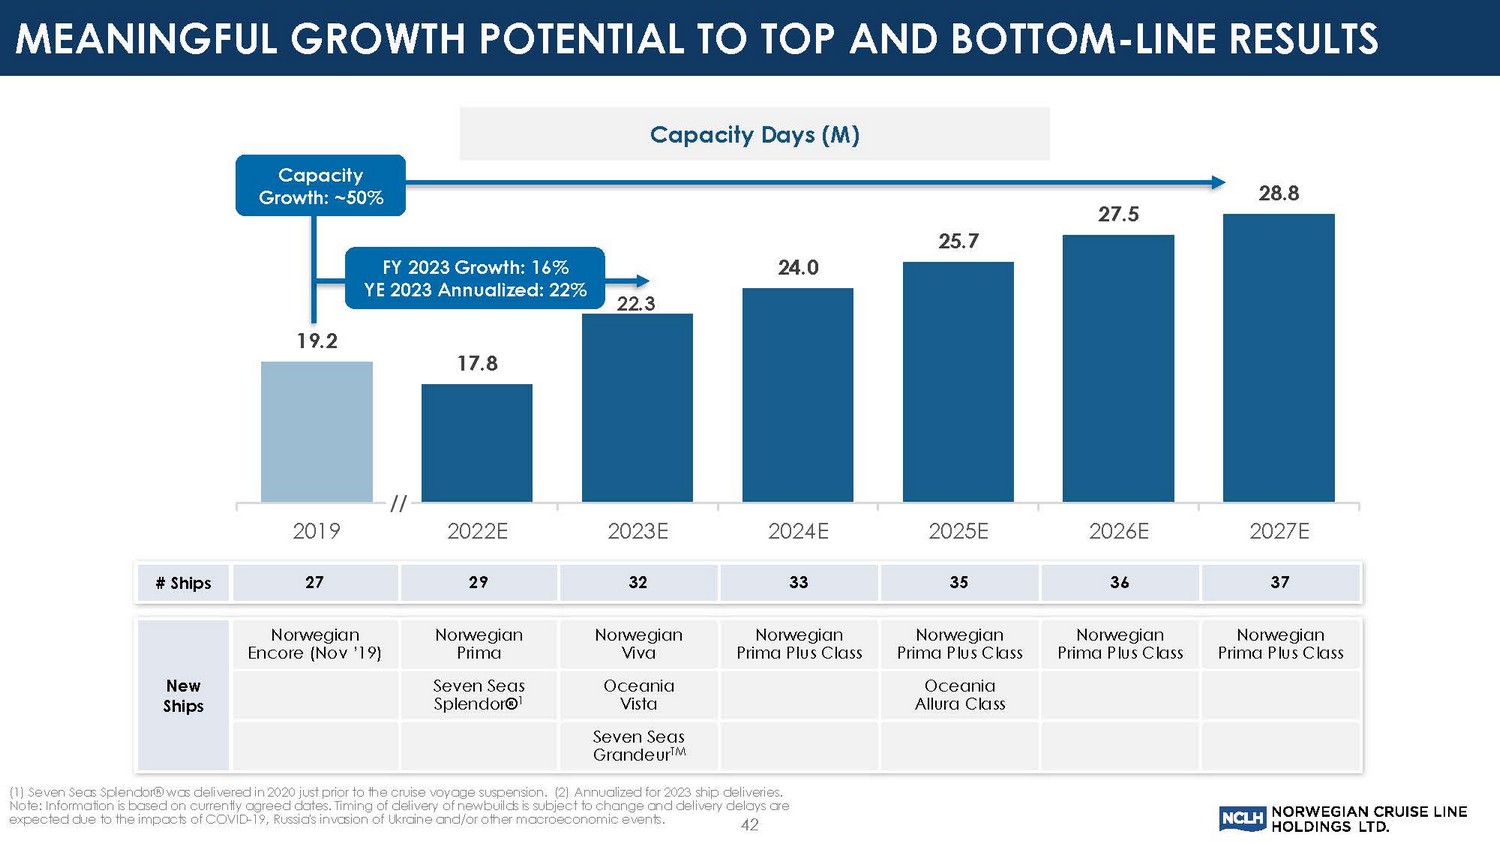
19.2 17.8 22.3 24.0 25.7 27.5 28.8 2019 2022E 2023E 2024E 2025E 2026E 2027E 42 # Ships 27 29 32 33 35 36 37 (1) Seven Seas Splendor® was delivered in 2020 just prior to the cruise voyage suspension. (2) Annualized for 2023 ship deli ver ies. Note: Information is based on currently agreed dates. Timing of delivery of newbuilds is subject to change and delivery delay s a re expected due to the impacts of COVID - 19, Russia's invasion of Ukraine and/or other macroeconomic events. New Ships Norwegian Encore (Nov ’19) Norwegian Prima Norwegian Viva Norwegian Prima Plus Class Norwegian Prima Plus Class Norwegian Prima Plus Class Norwegian Prima Plus Class Seven Seas Splendor® 1 Oceania Vista Oceania Allura Class Seven Seas Grandeur TM Capacity Growth: ~50% FY 2023 Growth: 16% YE 2023 Annualized: 22% Capacity Days (M) MEANINGFUL GROWTH POTENTIAL TO TOP AND BOTTOM - LINE RESULTS
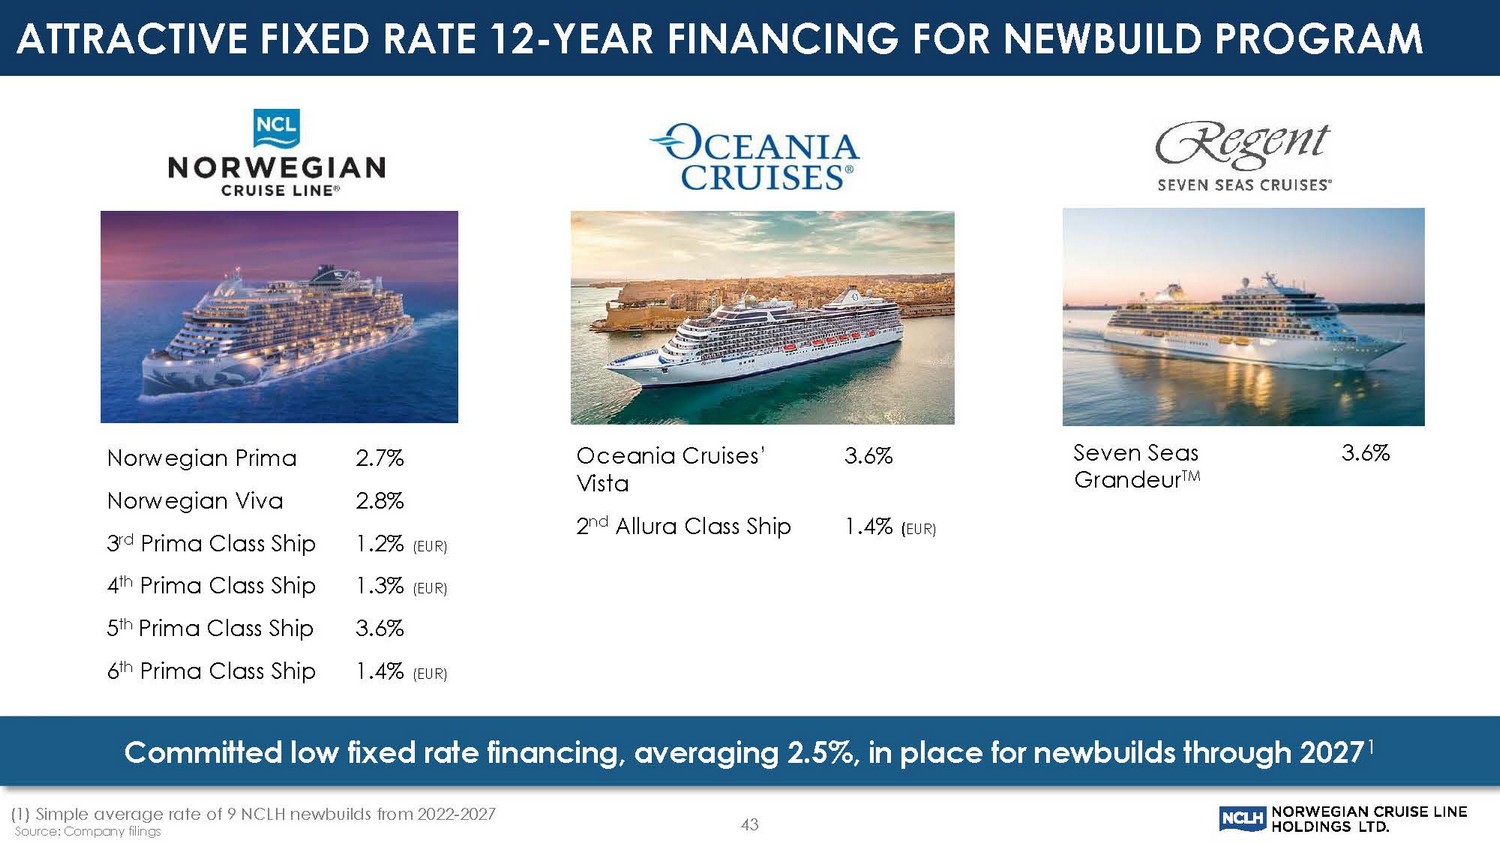
Source: Company filings 43 Committed low fixed rate financing, averaging 2.5%, in place for newbuilds through 2027 1 Norwegian Prima 2.7% Norwegian Viva 2.8% 3 rd Prima Class Ship 1.2% (EUR) 4 th Prima Class Ship 1.3% (EUR) 5 th Prima Class Ship 3.6% 6 th Prima Class Ship 1.4% (EUR) Oceania Cruises’ Vista 3.6% 2 nd Allura Class Ship 1.4% ( EUR) Seven Seas Grandeur TM 3.6% (1) Simple average rate of 9 NCLH newbuilds from 2022 - 2027 ATTRACTIVE FIXED RATE 12 - YEAR FINANCING FOR NEWBUILD PROGRAM
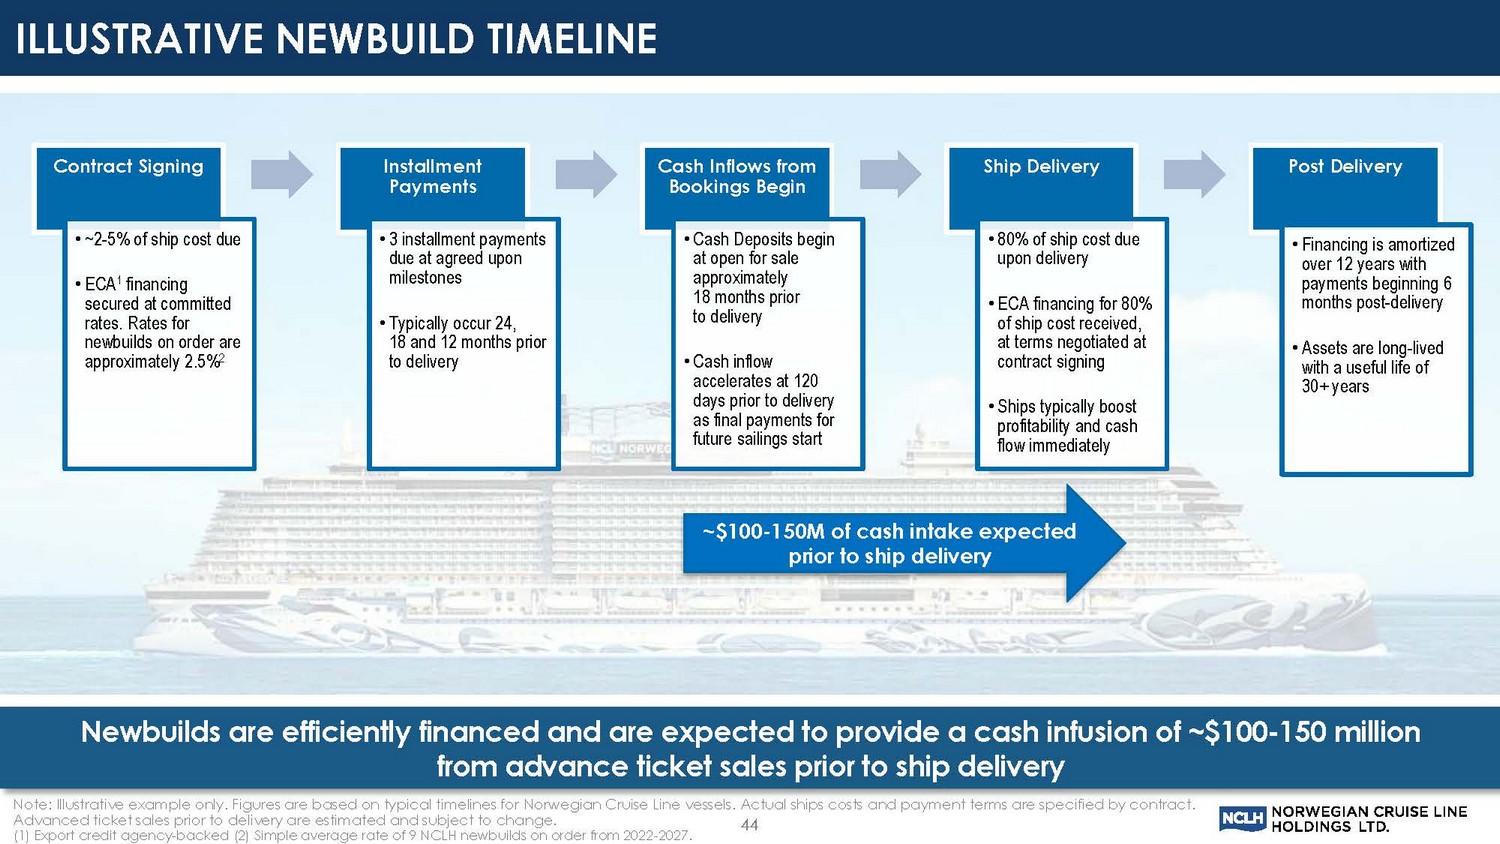
ILLUSTRATIVE NEWBUILD TIMELINE 44 Contract Signing • ~2 - 5% of ship cost due • ECA 1 financing secured at committed rates. Rates for newbuilds on order are approximately 2.5% 2 Installment Payments • 3 installment payments due at agreed upon milestones • Typically occur 24, 18 and 12 months prior to delivery Cash Inflows from Bookings Begin • Cash Deposits begin at open for sale approximately 18 months prior to delivery • Cash inflow accelerates at 120 days prior to delivery as final payments for future sailings start Ship Delivery • 80% of ship cost due upon delivery • ECA financing for 80% of ship cost received, at terms negotiated at contract signing • Ships typically boost profitability and cash flow immediately Post Delivery • Financing is amortized over 12 years with payments beginning 6 months post - delivery • Assets are long - lived with a useful life of 30+ years Newbuilds are efficiently financed and are expected to provide a cash infusion of ~$100 - 150 million from advance ticket sales prior to ship delivery Note: Illustrative example only. Figures are based on typical timelines for Norwegian Cruise Line vessels. Actual ships costs an d payment terms are specified by contract. Advanced ticket sales prior to delivery are estimated and subject to change. (1) Export credit agency - backed (2) Simple average rate of 9 NCLH newbuilds on order from 2022 - 2027. ~$100 - 150M of cash intake expected prior to ship delivery
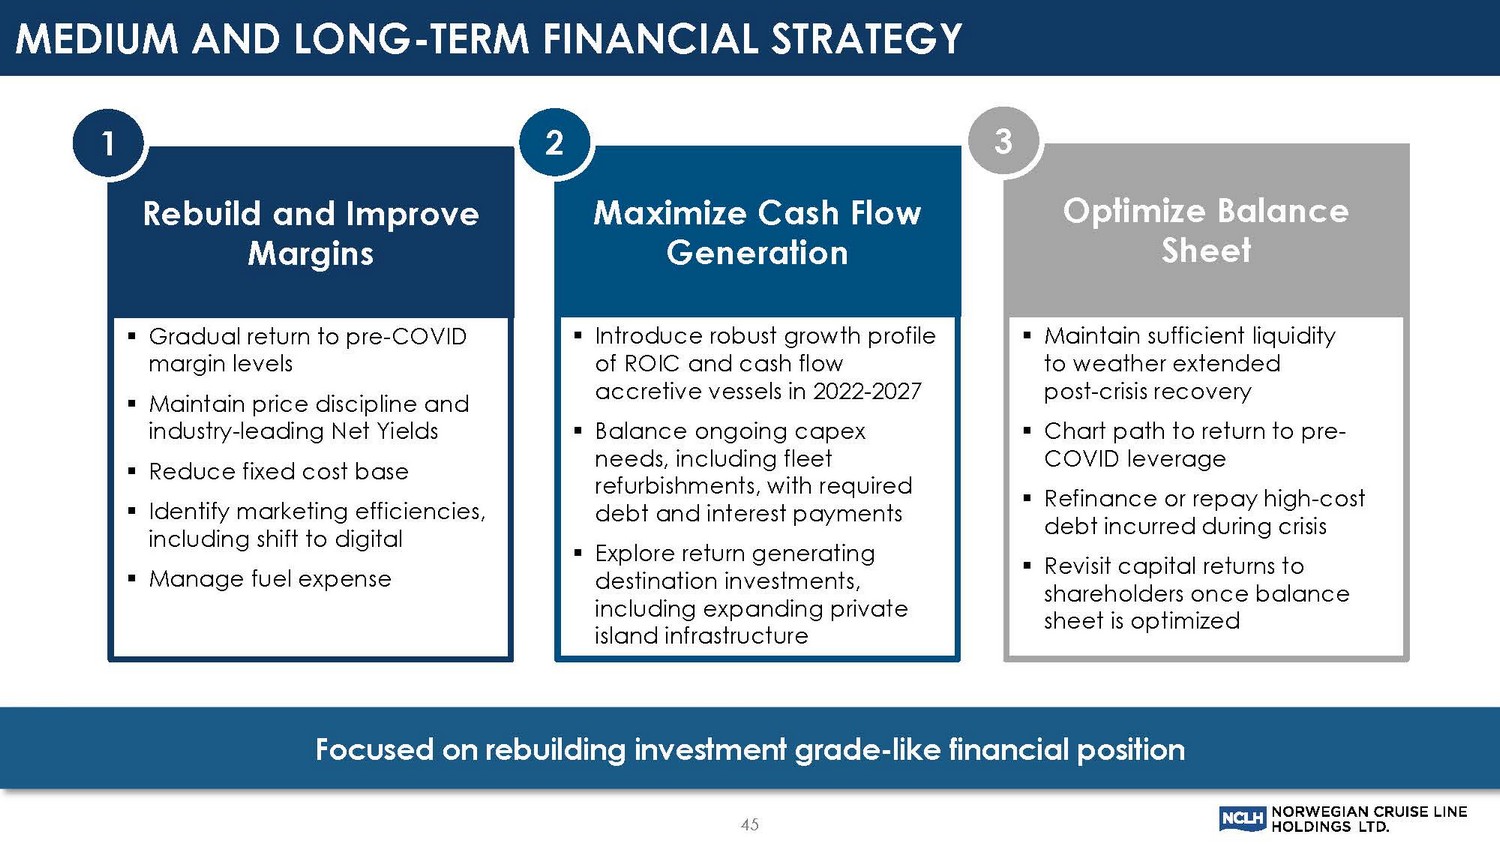
Focused on rebuilding investment grade - like financial position 45 Rebuild and Improve Margins ▪ Gradual return to pre - COVID margin levels ▪ Maintain price discipline and industry - leading Net Yields ▪ Reduce fixed cost base ▪ Identify marketing efficiencies, including shift to digital ▪ Manage fuel expense 1 Maximize Cash Flow Generation ▪ Introduce robust growth profile of ROIC and cash flow accretive vessels in 2022 - 2027 ▪ Balance ongoing capex needs, including fleet refurbishments, with required debt and interest payments ▪ Explore return generating destination investments, including expanding private island infrastructure 2 Optimize Balance Sheet ▪ Maintain sufficient liquidity to weather extended post - crisis recovery ▪ Chart path to return to pre - COVID leverage ▪ Refinance or repay high - cost debt incurred during crisis ▪ Revisit capital returns to shareholders once balance sheet is optimized 3 MEDIUM AND LONG - TERM FINANCIAL STRATEGY
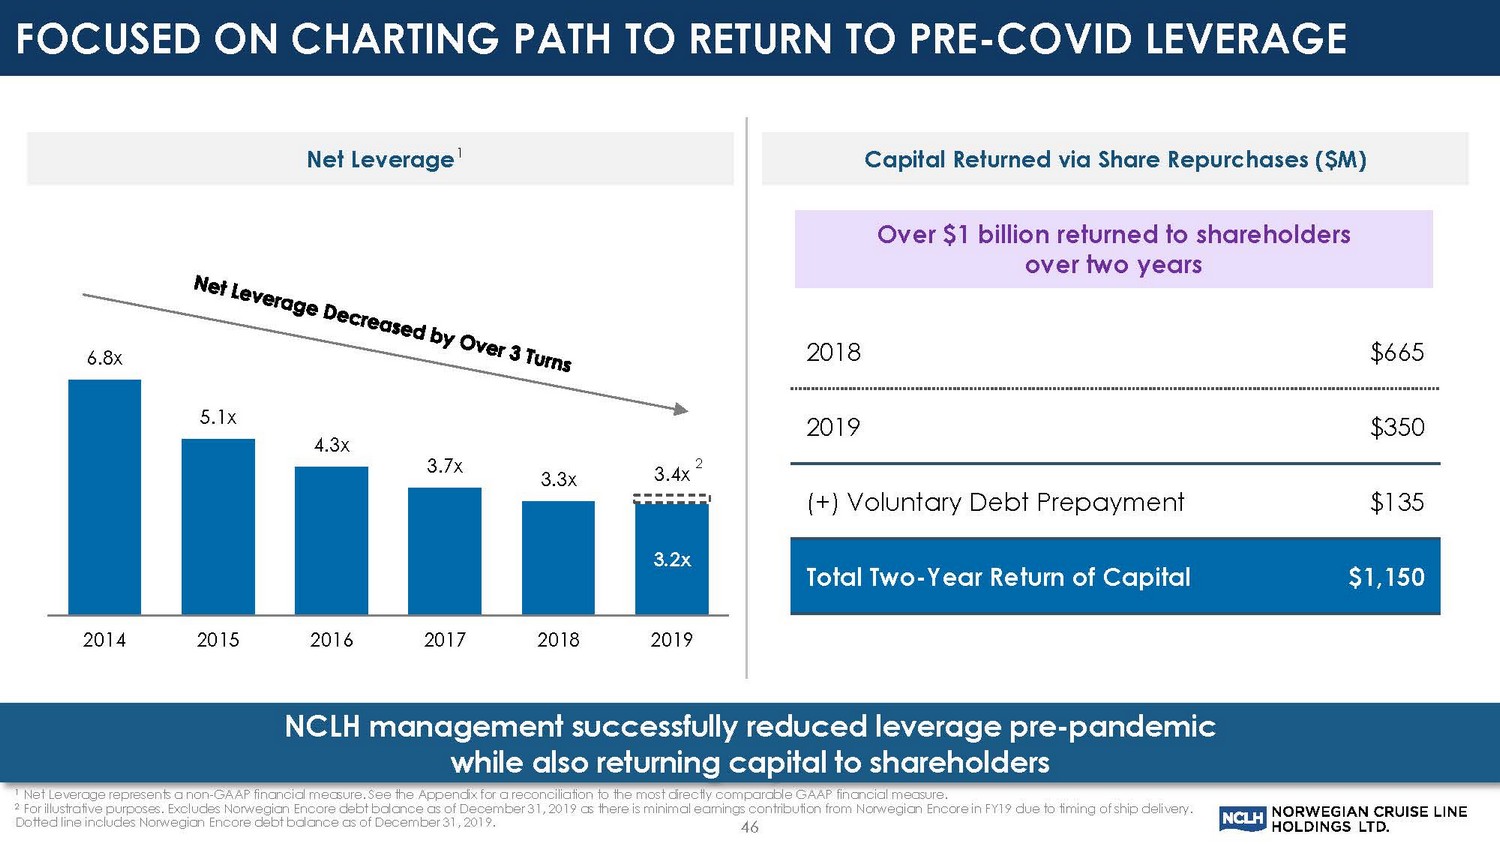
Net Leverage 1 1 1 Net Leverage represents a non - GAAP financial measure. See the Appendix for a reconciliation to the most directly comparable GAAP financial measure. 2 For illustrative purposes. Excludes Norwegian Encore debt balance as of December 31, 2019 as there is minimal earnings contri bu tion from Norwegian Encore in FY19 due to timing of ship delivery. Dotted line includes Norwegian Encore debt balance as of December 31, 2019. 3.2x 6.8x 5.1x 4.3x 3.7x 3.3x 3.4x 2014 2015 2016 2017 2018 2019 NCLH management successfully reduced leverage pre - pandemic while also returning capital to shareholders 46 2018 $665 2019 $350 (+) Voluntary Debt Prepayment $135 Total Two - Year Return of Capital $1,150 Over $1 billion returned to shareholders over two years Capital Returned via Share Repurchases ($M) 2 FOCUSED ON CHARTING PATH TO RETURN TO PRE - COVID LEVERAGE
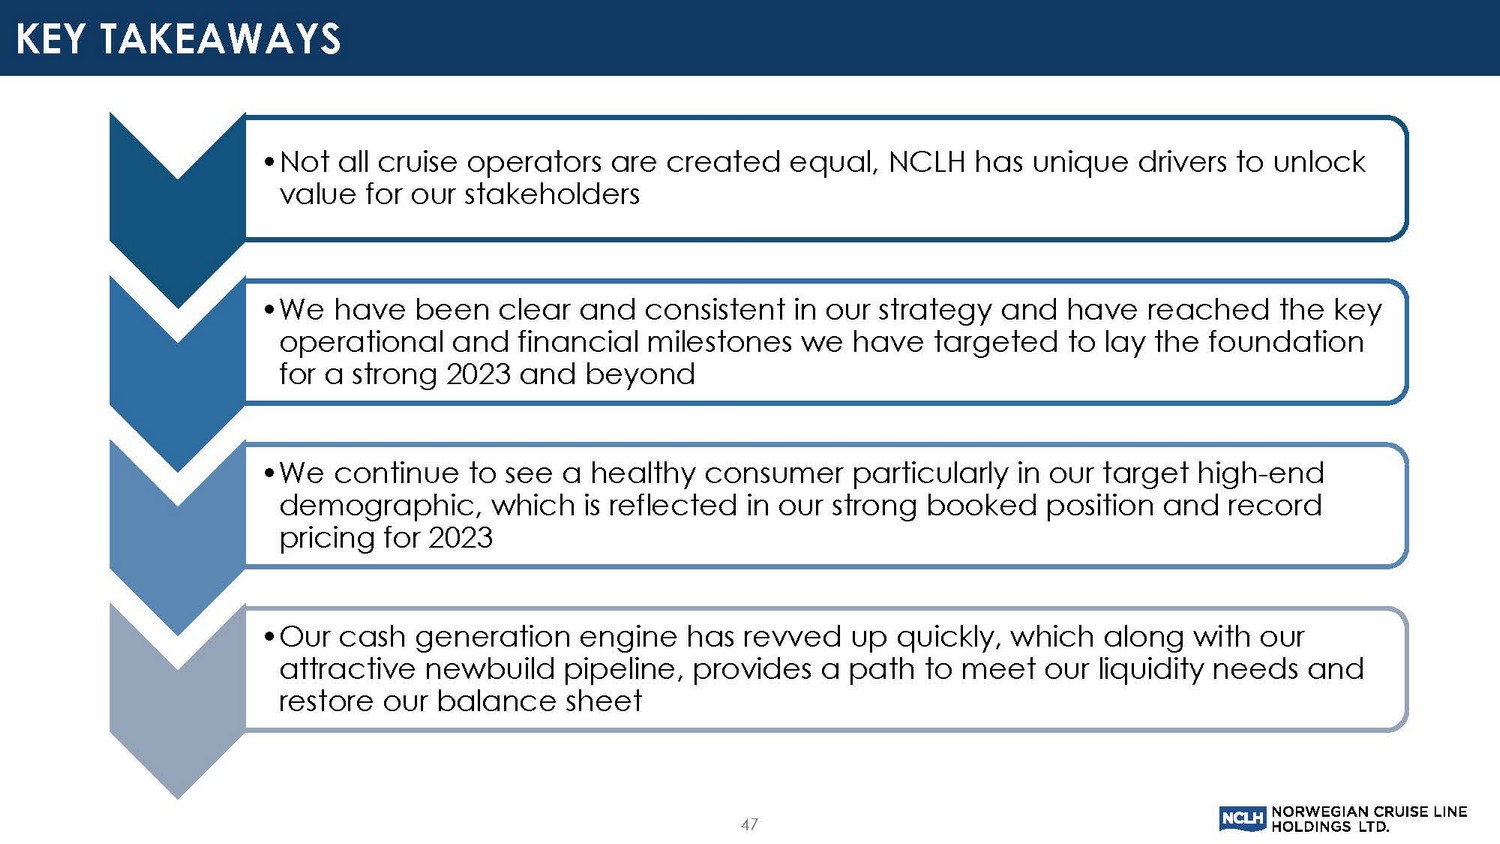
47 • Not all cruise operators are created equal, NCLH has unique drivers to unlock value for our stakeholders • We have been clear and consistent in our strategy and have reached the key operational and financial milestones we have targeted to lay the foundation for a strong 2023 and beyond • We continue to see a healthy consumer particularly in our target high - end demographic, which is reflected in our strong booked position and record pricing for 2023 • Our cash generation engine has revved up quickly, which along with our attractive newbuild pipeline, provides a path to meet our liquidity needs and restore our balance sheet KEY TAKEAWAYS

QUESTIONS? 48
49 TOP RANKED QUESTIONS FROM NEW SHAREHOLDER Q&A PLATFORM
50 APPENDIX
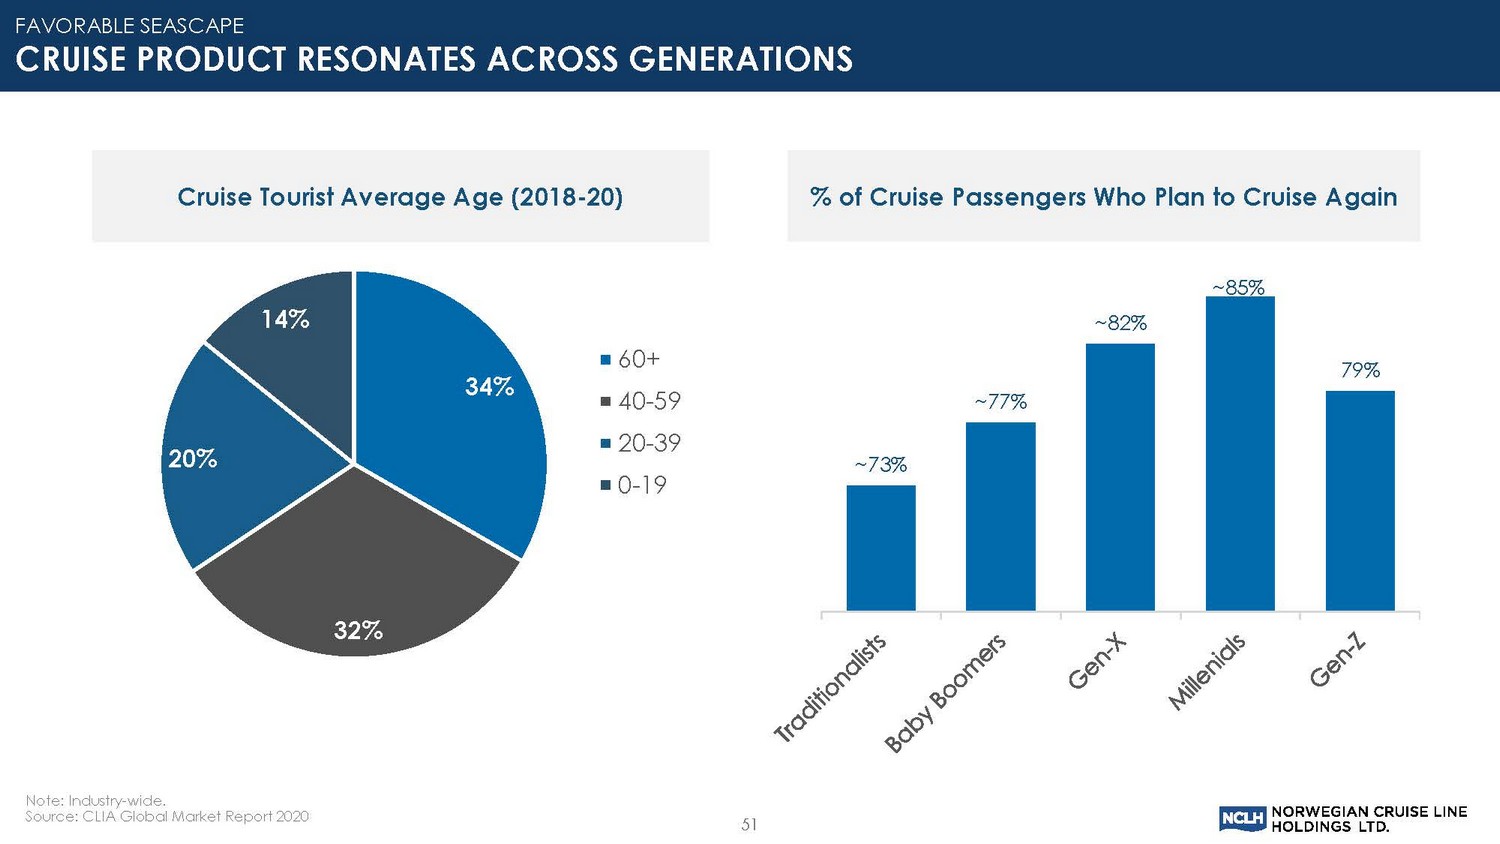
Note: Industry - wide. Source: CLIA Global Market Report 2020 51 FAVORABLE SEASCAPE CRUISE PRODUCT RESONATES ACROSS GENERATIONS % of Cruise Passengers Who Plan to Cruise Again ~ 73% ~ 77% ~ 82% ~ 85% 79% Cruise Tourist Average Age (2018 - 20) 34% 32% 20% 14% 60+ 40-59 20-39 0-19
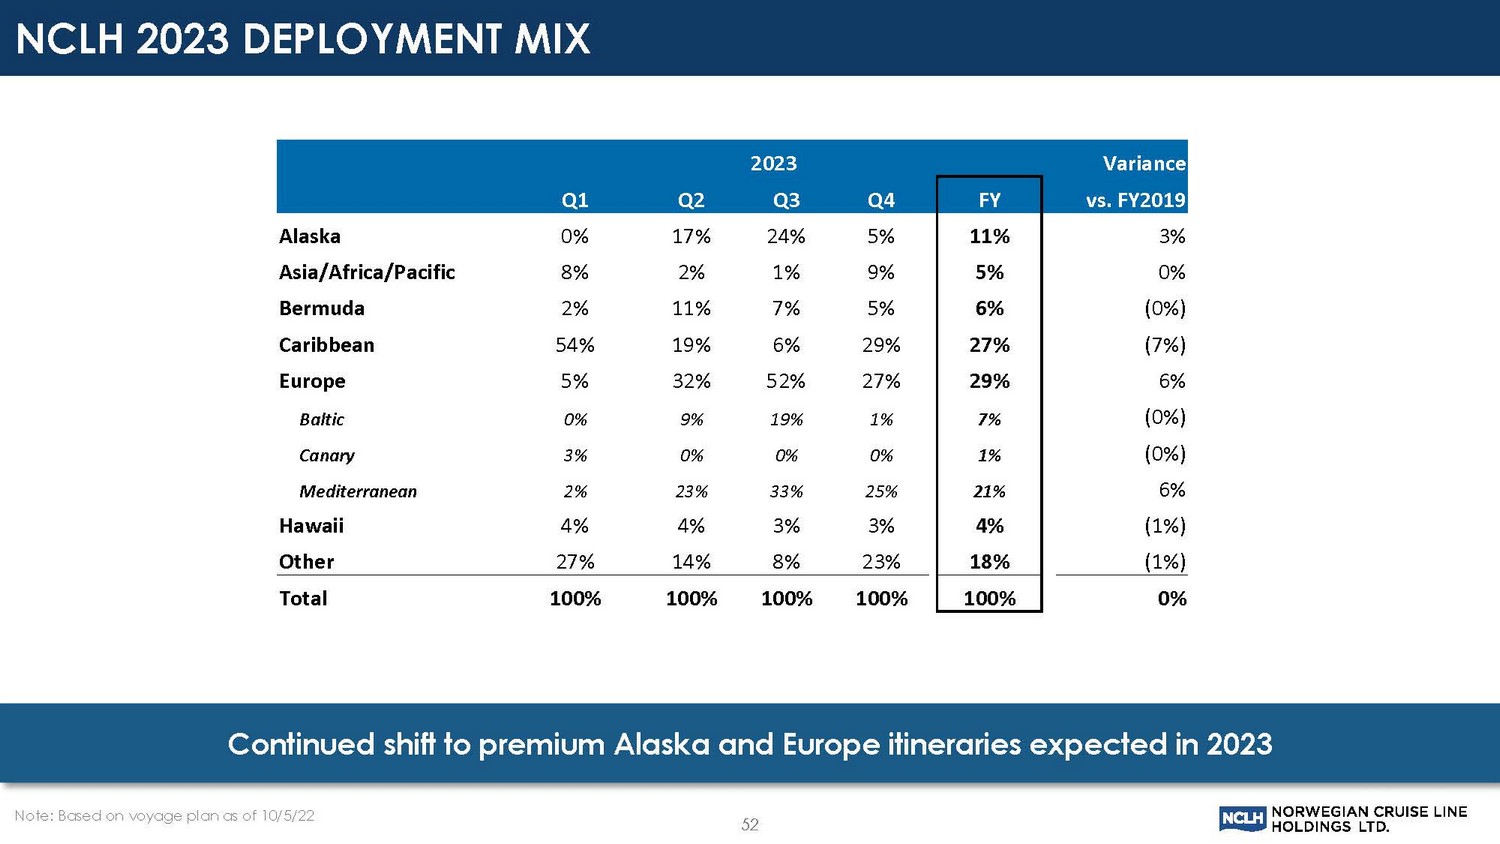
NCLH 2023 DEPLOYMENT MIX Note: Based on voyage plan as of 10/5/22 52 Continued shift to premium Alaska and Europe itineraries expected in 2023 2023 Variance Q1 Q2 Q3 Q4 FY vs. FY2019 Alaska 0% 17% 24% 5% 11% 3% Asia/Africa/Pacific 8% 2% 1% 9% 5% 0% Bermuda 2% 11% 7% 5% 6% (0%) Caribbean 54% 19% 6% 29% 27% (7%) Europe 5% 32% 52% 27% 29% 6% Baltic 0% 9% 19% 1% 7% (0%) Canary 3% 0% 0% 0% 1% (0%) Mediterranean 2% 23% 33% 25% 21% 6% Hawaii 4% 4% 3% 3% 4% (1%) Other 27% 14% 8% 23% 18% (1%) Total 100% 100% 100% 100% 100% 0%
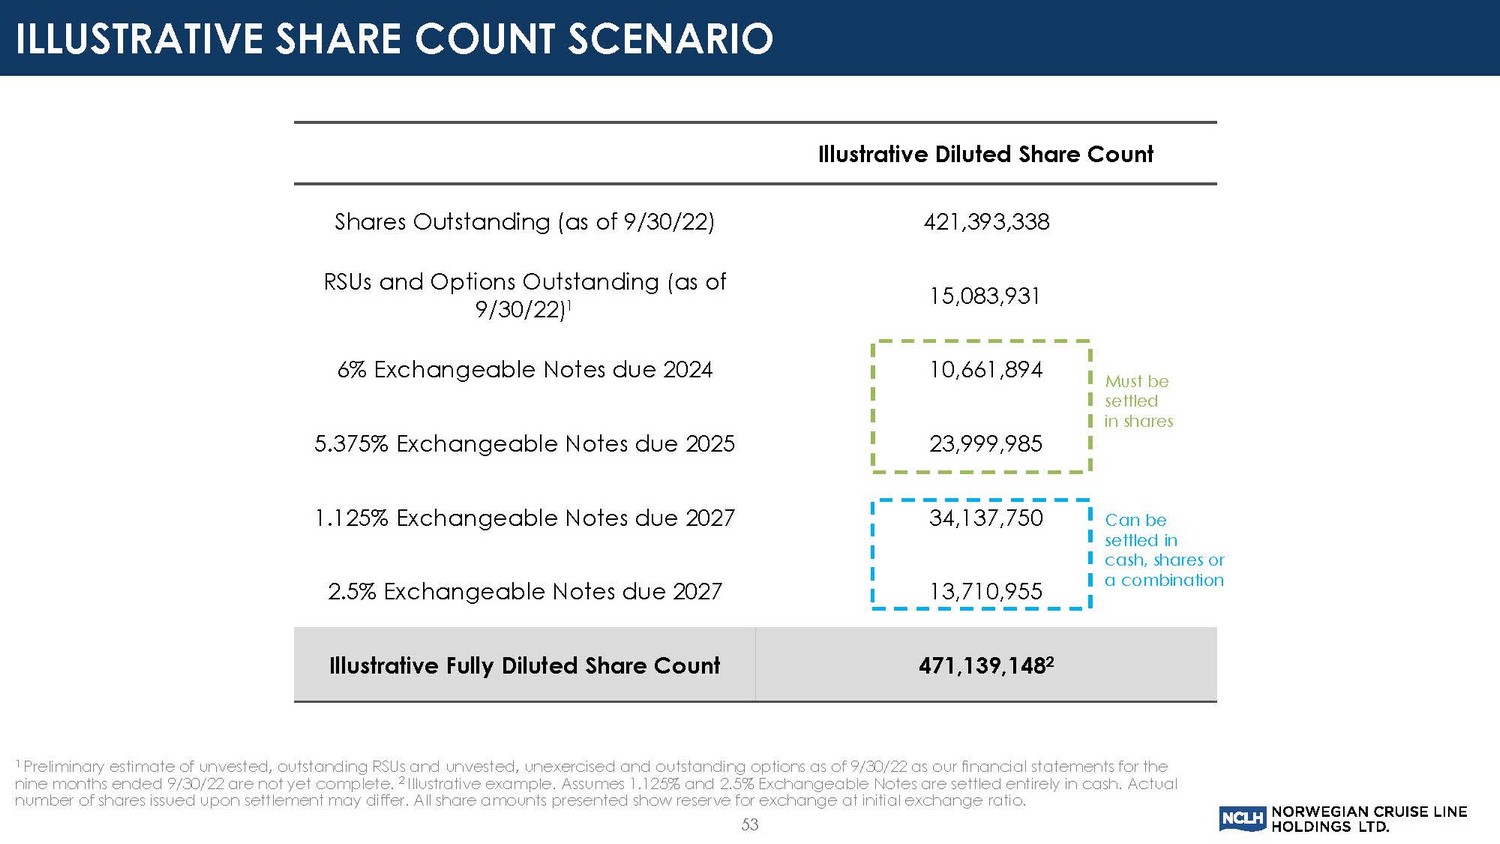
ILLUSTRATIVE SHARE COUNT SCENARIO Illustrative Diluted Share Count Shares Outstanding (as of 9/30/22) 421,393,338 RSUs and Options Outstanding (as of 9/30/22) 1 15,083,931 6% Exchangeable Notes due 2024 10,661,894 5.375% Exchangeable Notes due 2025 23,999,985 1.125% Exchangeable Notes due 2027 34,137,750 2.5% Exchangeable Notes due 2027 13,710,955 Illustrative Fully Diluted Share Count 471,139,148 2 1 Preliminary estimate of unvested, outstanding RSUs and unvested, unexercised and outstanding options as of 9/30/22 as our fin anc ial statements for the nine months ended 9/30/22 are not yet complete. 2 Illustrative example. Assumes 1.125% and 2.5% Exchangeable Notes are settled entirely in cash. Actual number of shares issued upon settlement may differ. All share amounts presented show reserve for exchange at initial exchange ra tio. Must be settled in shares Can be settled in cash, shares or a combination 53
DEFINITIONS AND NON - GAAP INFORMATION AND RECONCILIATIONS 54
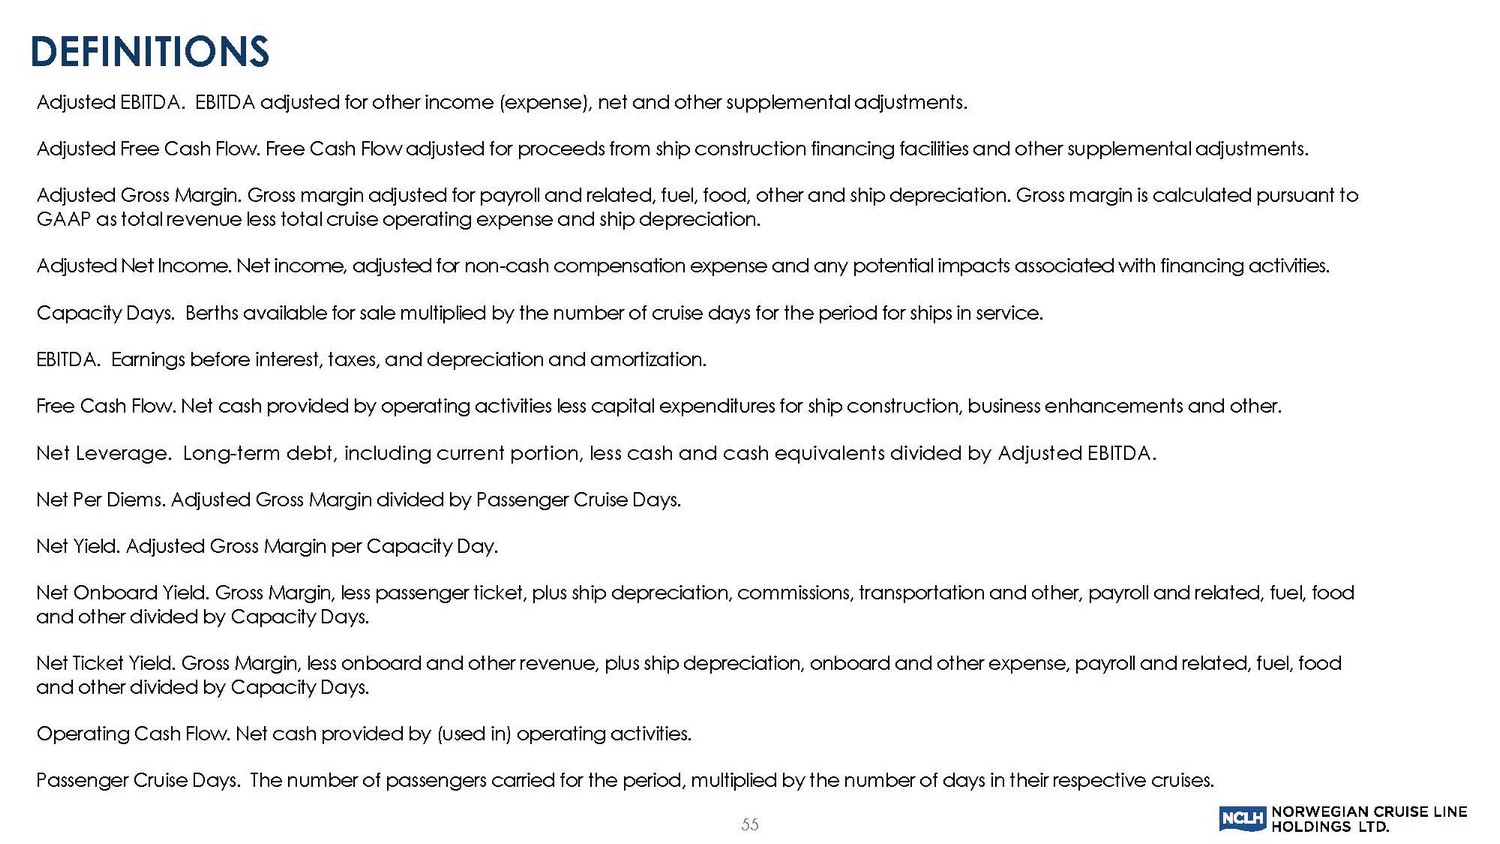
Adjusted EBITDA. EBITDA adjusted for other income (expense), net and other supplemental adjustments. Adjusted Free Cash Flow. Free Cash Flow adjusted for proceeds from ship construction financing facilities and other supplemen tal adjustments. Adjusted Gross Margin. Gross margin adjusted for payroll and related, fuel, food, other and ship depreciation. Gross margin i s c alculated pursuant to GAAP as total revenue less total cruise operating expense and ship depreciation. Adjusted Net Income. Net income, adjusted for non - cash compensation expense and any potential impacts associated with financing activities. Capacity Days. Berths available for sale multiplied by the number of cruise days for the period for ships in service. EBITDA. Earnings before interest, taxes, and depreciation and amortization. Free Cash Flow. Net cash provided by operating activities less capital expenditures for ship construction, business enhanceme nts and other. Net Leverage. Long - term debt, including current portion, less cash and cash equivalents divided by Adjusted EBITDA. Net Per Diems. Adjusted Gross Margin divided by Passenger Cruise Days. Net Yield. Adjusted Gross Margin per Capacity Day. Net Onboard Yield. Gross Margin, less passenger ticket, plus ship depreciation, commissions, transportation and other, payrol l a nd related, fuel, food and other divided by Capacity Days. Net Ticket Yield. Gross Margin, less onboard and other revenue, plus ship depreciation, onboard and other expense, payroll an d r elated, fuel, food and other divided by Capacity Days. Operating Cash Flow. Net cash provided by (used in) operating activities. Passenger Cruise Days. The number of passengers carried for the period, multiplied by the number of days in their respective cr uises. DEFINITIONS 55
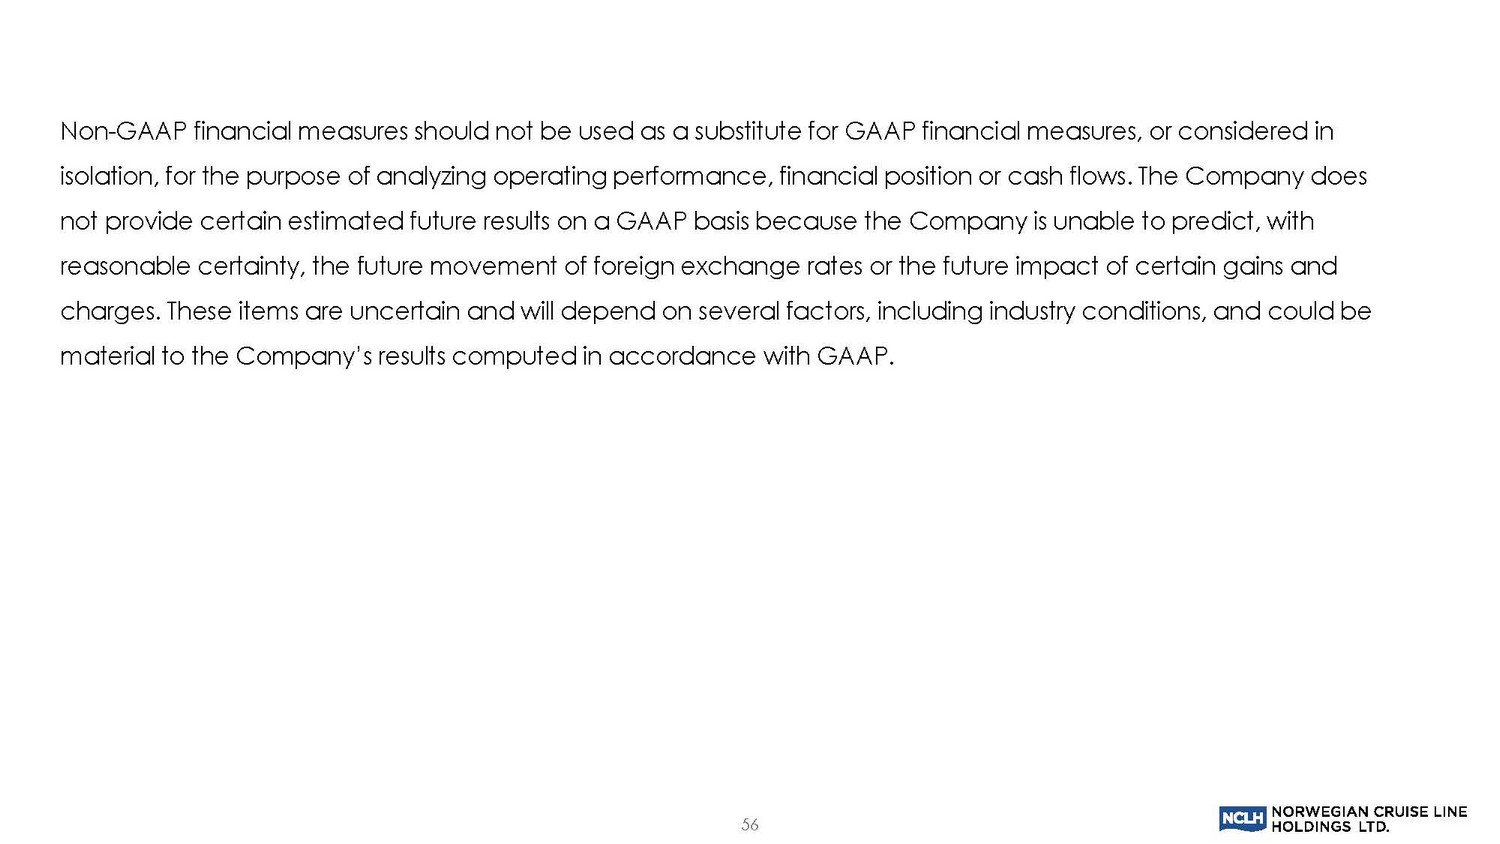
Non - GAAP financial measures should not be used as a substitute for GAAP financial measures, or considered in isolation, for the purpose of analyzing operating performance, financial position or cash flows. The Company does not provide certain estimated future results on a GAAP basis because the Company is unable to predict, with reasonable certainty, the future movement of foreign exchange rates or the future impact of certain gains and charges. These items are uncertain and will depend on several factors, including industry conditions, and could be material to the Company’s results computed in accordance with GAAP. 56
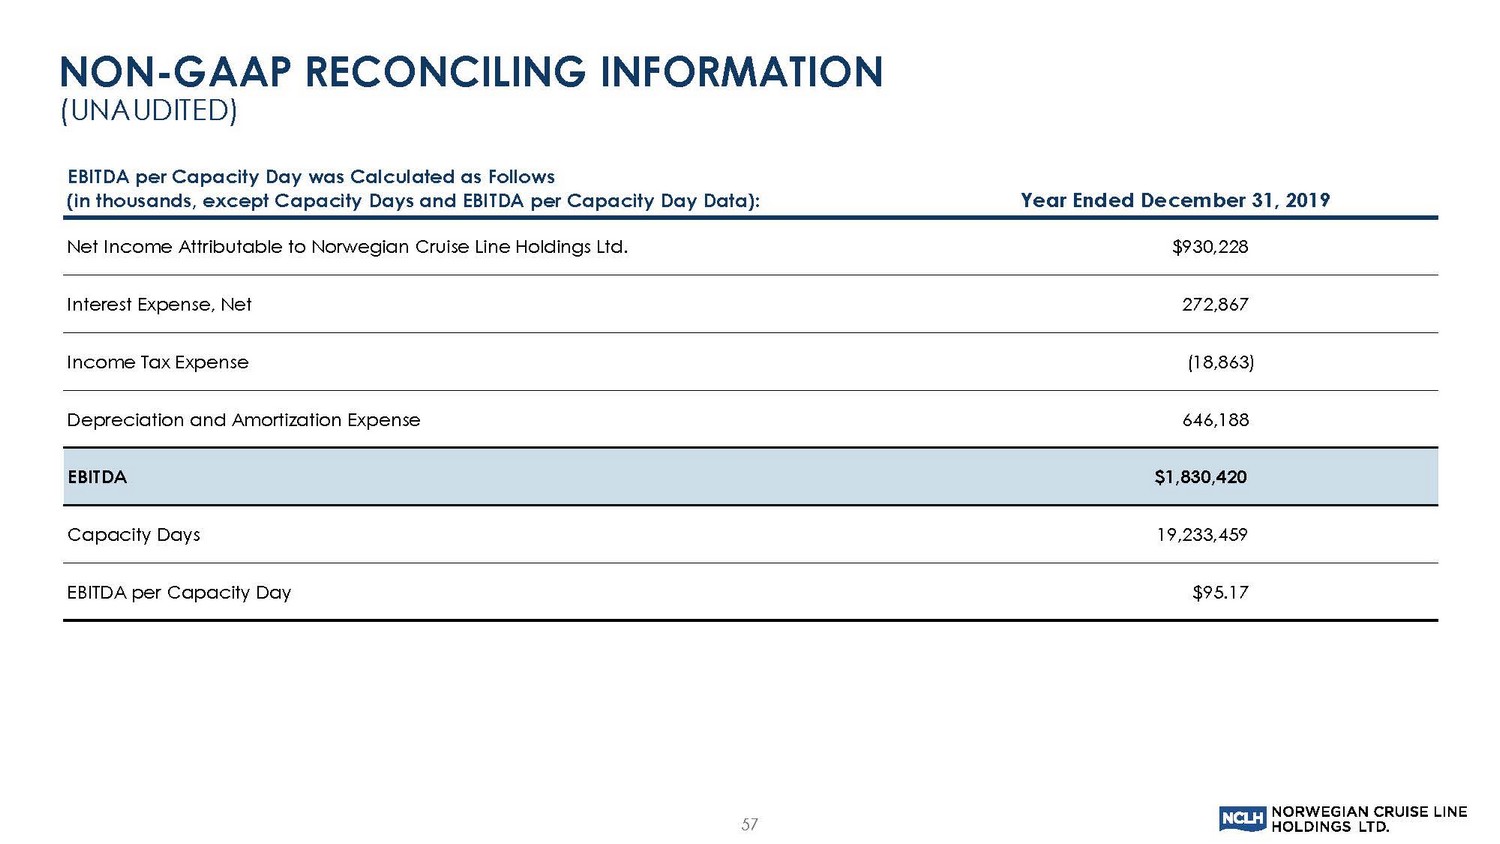
57 EBITDA per Capacity Day was Calculated as Follows (in thousands, except Capacity Days and EBITDA per Capacity Day Data): Year Ended December 31, 2019 Net Income Attributable to Norwegian Cruise Line Holdings Ltd. $930,228 Interest Expense, Net 272,867 Income Tax Expense (18,863) Depreciation and Amortization Expense 646,188 EBITDA $1,830,420 Capacity Days 19,233,459 EBITDA per Capacity Day $95.17 NON - GAAP RECONCILING INFORMATION (UNAUDITED)
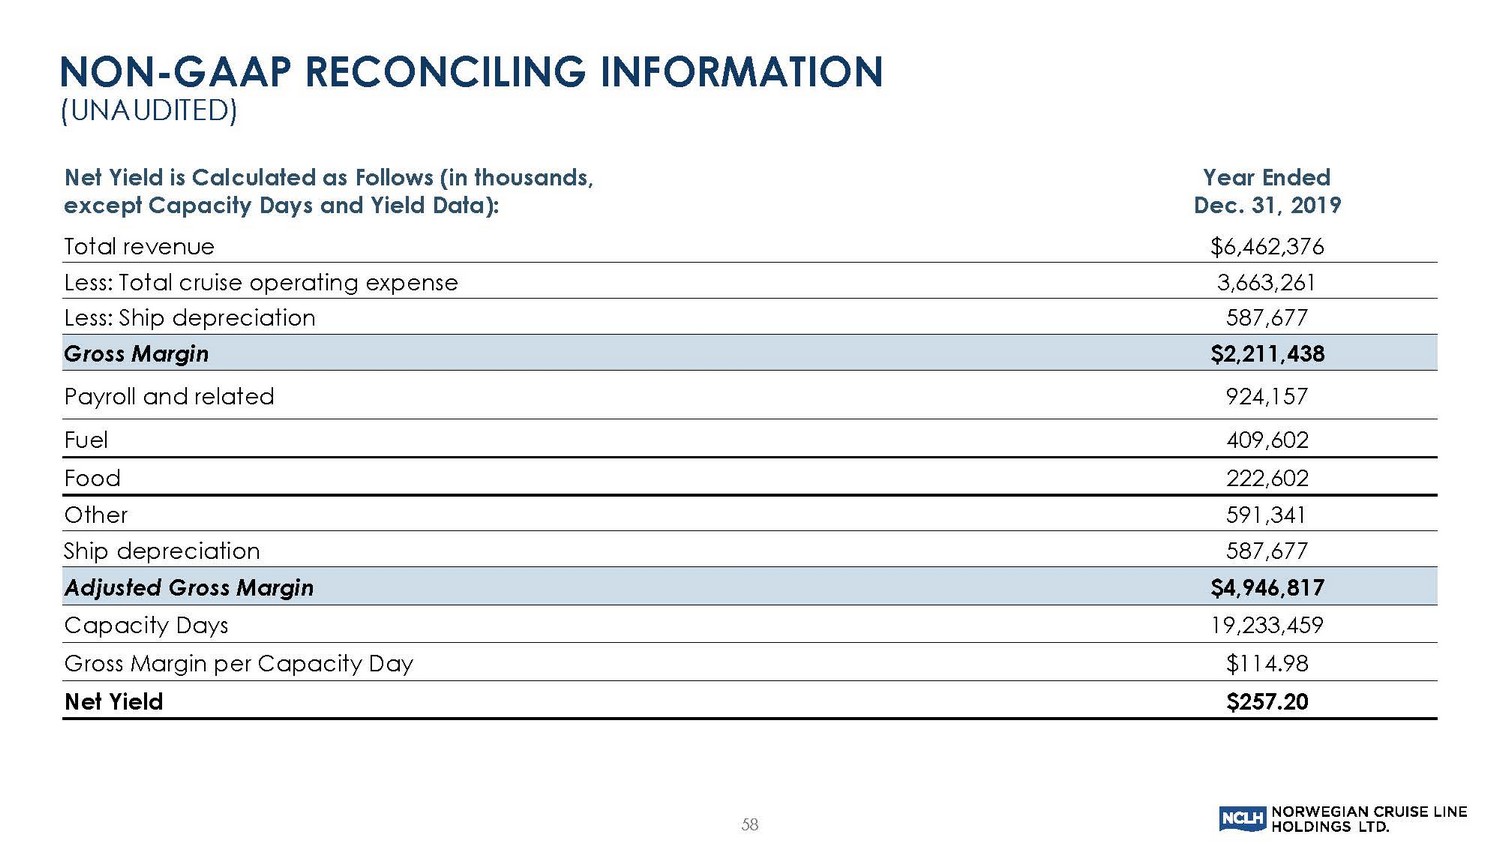
58 Net Yield is Calculated as Follows (in thousands, except Capacity Days and Yield Data): Year Ended Dec. 31, 2019 Total revenue $6,462,376 Less: Total cruise operating expense 3,663,261 Less: Ship depreciation 587,677 Gross Margin $2,211,438 Payroll and related 924,157 Fuel 409,602 Food 222,602 Other 591,341 Ship depreciation 587,677 Adjusted Gross Margin $4,946,817 Capacity Days 19,233,459 Gross Margin per Capacity Day $114.98 Net Yield $257.20 NON - GAAP RECONCILING INFORMATION (UNAUDITED)
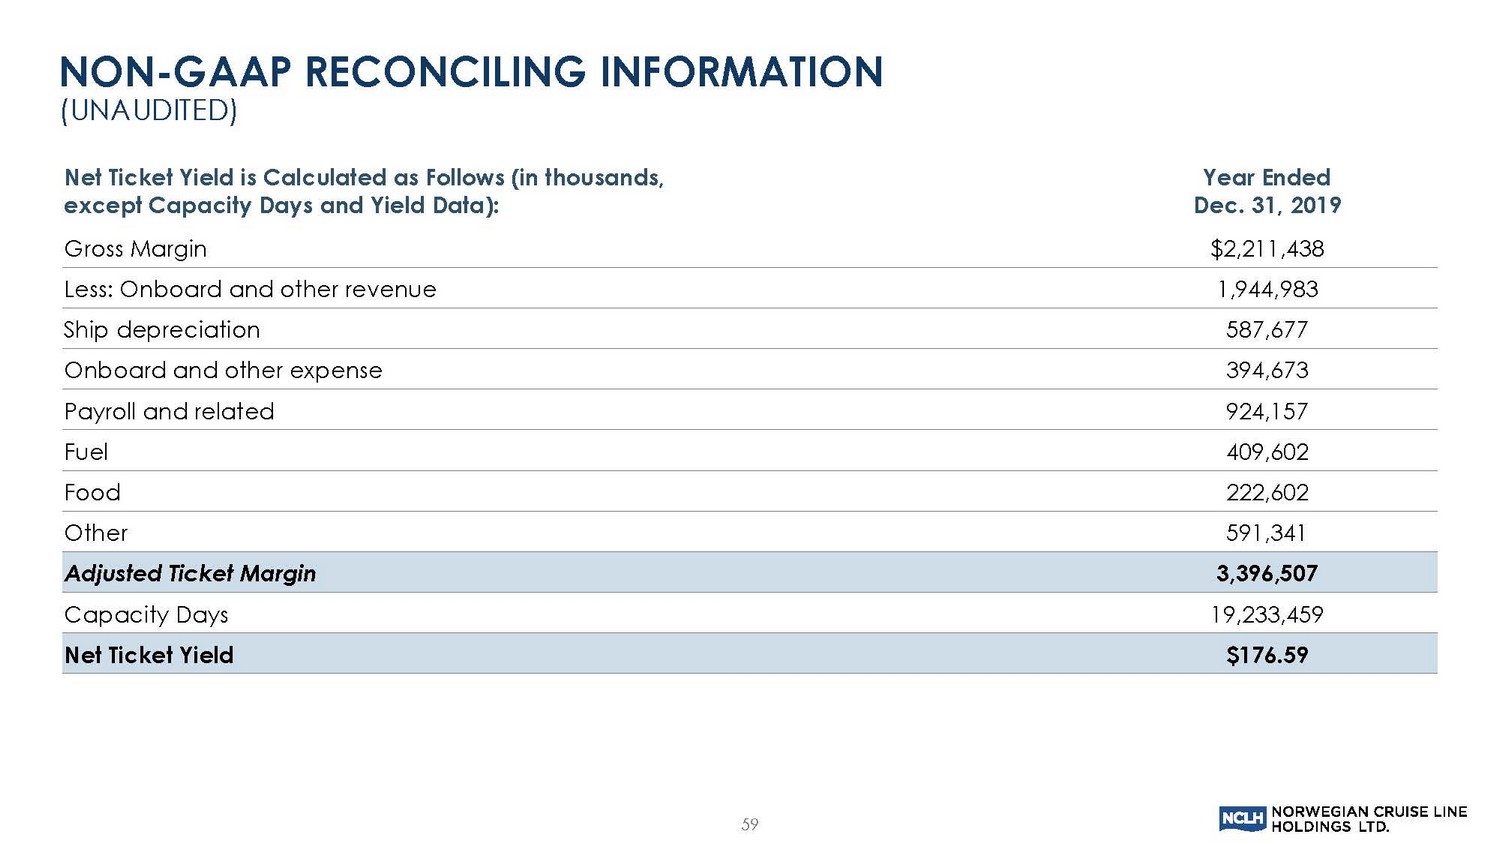
59 Net Ticket Yield is Calculated as Follows (in thousands, except Capacity Days and Yield Data): Year Ended Dec. 31, 2019 Gross Margin $2,211,438 Less: Onboard and other revenue 1,944,983 Ship depreciation 587,677 Onboard and other expense 394,673 Payroll and related 924,157 Fuel 409,602 Food 222,602 Other 591,341 Adjusted Ticket Margin 3,396,507 Capacity Days 19,233,459 Net Ticket Yield $176.59 NON - GAAP RECONCILING INFORMATION (UNAUDITED)
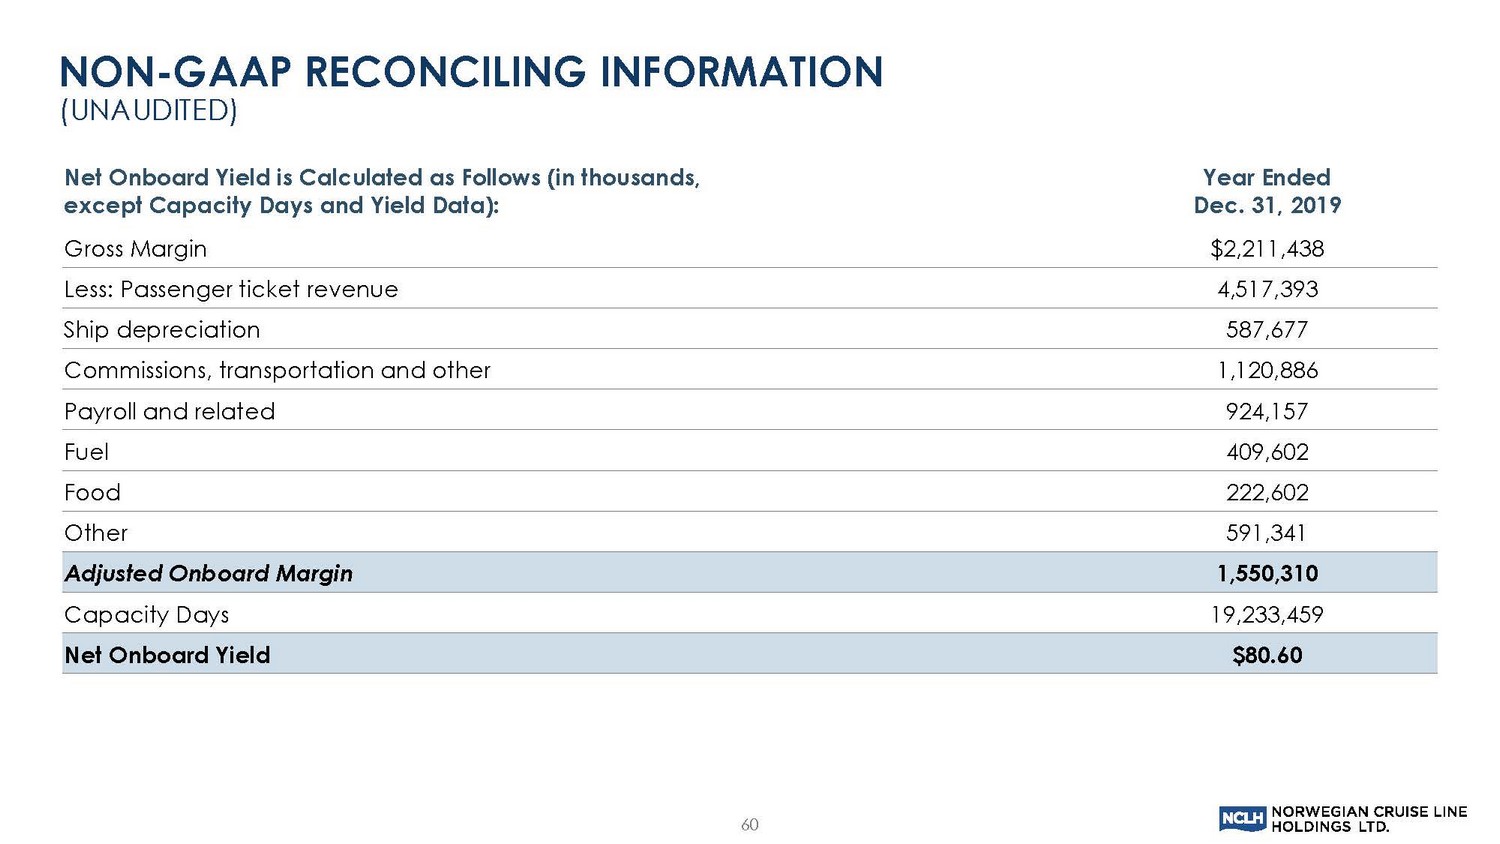
60 Net Onboard Yield is Calculated as Follows (in thousands, except Capacity Days and Yield Data): Year Ended Dec. 31, 2019 Gross Margin $2,211,438 Less: Passenger ticket revenue 4,517,393 Ship depreciation 587,677 Commissions, transportation and other 1,120,886 Payroll and related 924,157 Fuel 409,602 Food 222,602 Other 591,341 Adjusted Onboard Margin 1,550,310 Capacity Days 19,233,459 Net Onboard Yield $80.60 NON - GAAP RECONCILING INFORMATION (UNAUDITED)
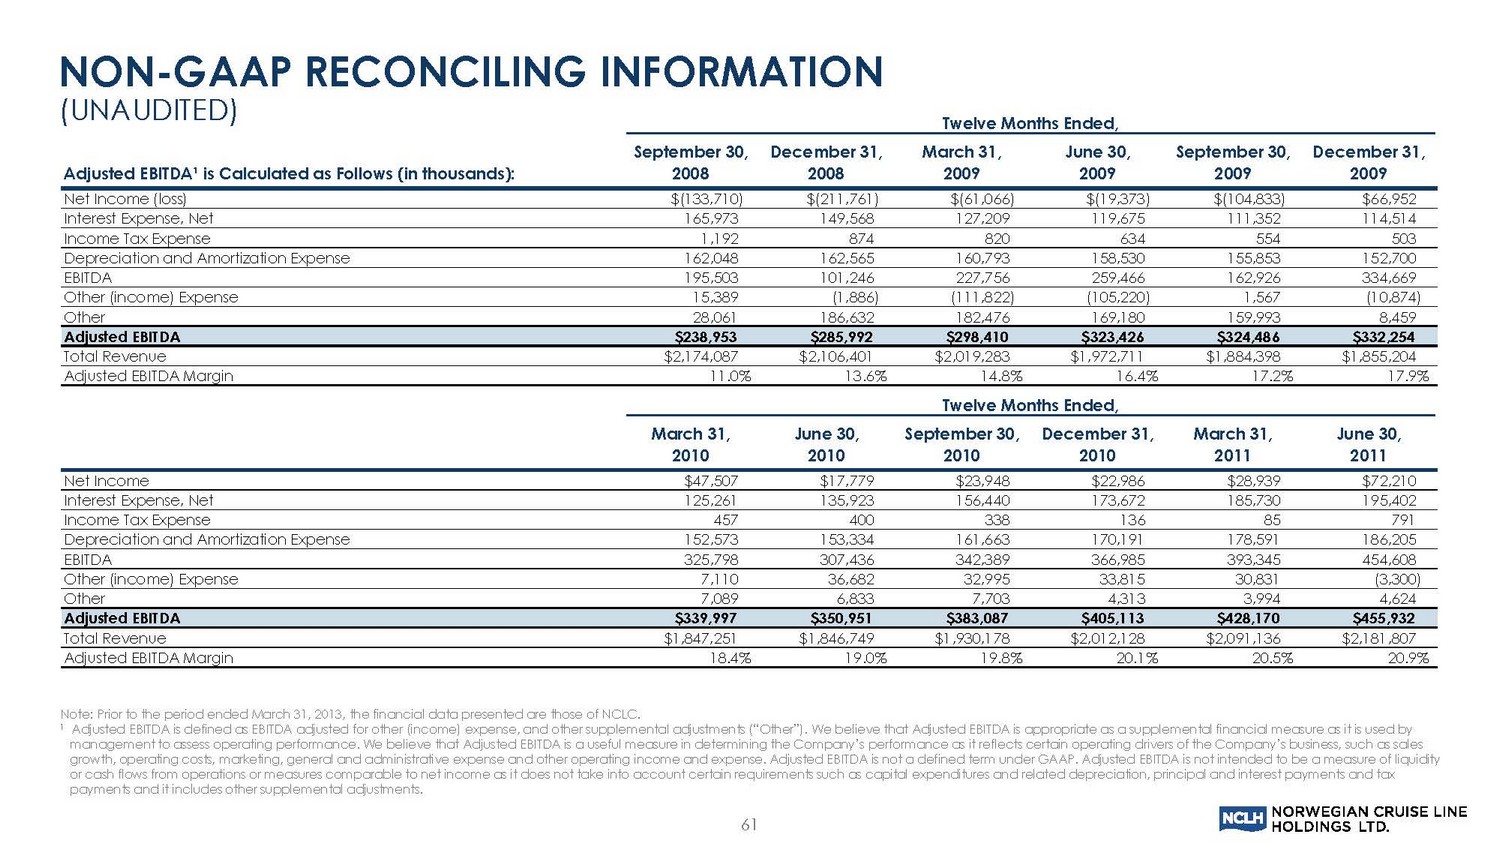
Note: Prior to the period ended March 31, 2013, the financial data presented are those of NCLC. 1 Adjusted EBITDA is defined as EBITDA adjusted for other (income) expense, and other supplemental adjustments (“Other”). We be l ieve that Adjusted EBITDA is appropriate as a supplemental financial measure as it is used by management to assess operating performance. We believe that Adjusted EBITDA is a useful measure in determining the Company’s per formance as it reflects certain operating drivers of the Company’s business, such as sales growth, operating costs, marketing, general and administrative expense and other operating income and expense. Adjusted EBITD A i s not a defined term under GAAP. Adjusted EBITDA is not intended to be a measure of liquidity or cash flows from operations or measures comparable to net income as it does not take into account certain requirements such as capital expenditures and related depreciation, principal and interest payments and tax payments and it includes other supplemental adjustments. Twelve Months Ended, Adjusted EBITDA¹ is Calculated as Follows (in thousands): September 30, 2008 December 31, 2008 March 31, 2009 June 30, 2009 September 30, 2009 December 31, 2009 Net Income (loss) $(133,710) $(211,761) $(61,066) $(19,373) $(104,833) $66,952 Interest Expense, Net 165,973 149,568 127,209 119,675 111,352 114,514 Income Tax Expense 1,192 874 820 634 554 503 Depreciation and Amortization Expense 162,048 162,565 160,793 158,530 155,853 152,700 EBITDA 195,503 101,246 227,756 259,466 162,926 334,669 Other (income) Expense 15,389 (1,886) (111,822) (105,220) 1,567 (10,874) Other 28,061 186,632 182,476 169,180 159,993 8,459 Adjusted EBITDA $238,953 $285,992 $298,410 $323,426 $324,486 $332,254 Total Revenue $2,174,087 $2,106,401 $2,019,283 $1,972,711 $1,884,398 $1,855,204 Adjusted EBITDA Margin 11.0% 13.6% 14.8% 16.4% 17.2% 17.9% Twelve Months Ended, March 31, 2010 June 30, 2010 September 30, 2010 December 31, 2010 March 31, 2011 June 30, 2011 Net Income $47,507 $17,779 $23,948 $22,986 $28,939 $72,210 Interest Expense, Net 125,261 135,923 156,440 173,672 185,730 195,402 Income Tax Expense 457 400 338 136 85 791 Depreciation and Amortization Expense 152,573 153,334 161,663 170,191 178,591 186,205 EBITDA 325,798 307,436 342,389 366,985 393,345 454,608 Other (income) Expense 7,110 36,682 32,995 33,815 30,831 (3,300) Other 7,089 6,833 7,703 4,313 3,994 4,624 Adjusted EBITDA $339,997 $350,951 $383,087 $405,113 $428,170 $455,932 Total Revenue $1,847,251 $1,846,749 $1,930,178 $2,012,128 $2,091,136 $2,181,807 Adjusted EBITDA Margin 18.4% 19.0% 19.8% 20.1% 20.5% 20.9% NON - GAAP RECONCILING INFORMATION (UNAUDITED) 61
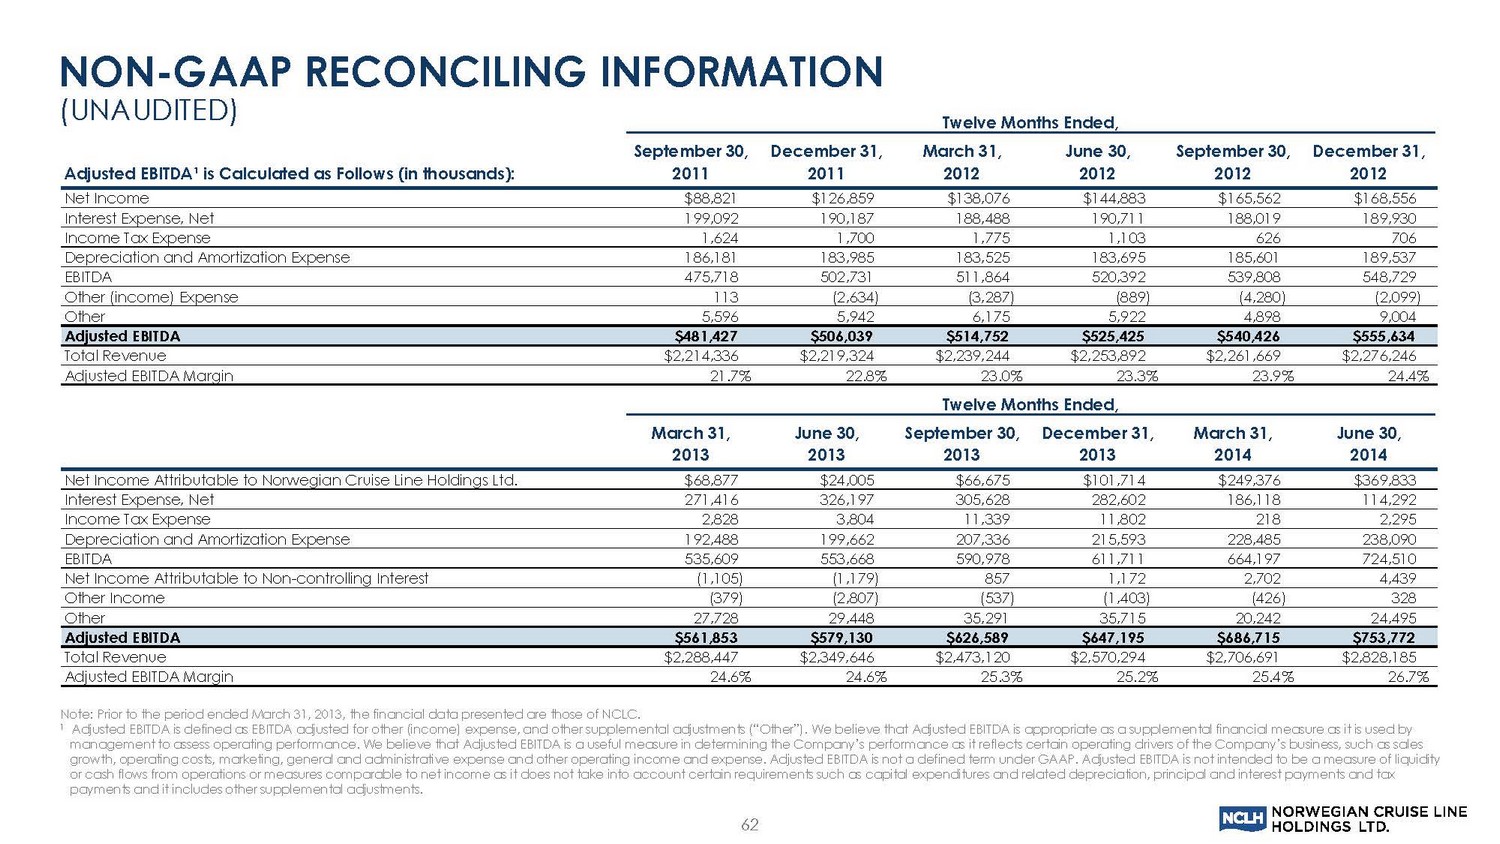
Note: Prior to the period ended March 31, 2013, the financial data presented are those of NCLC. 1 Adjusted EBITDA is defined as EBITDA adjusted for other (income) expense, and other supplemental adjustments (“Other”). We be l ieve that Adjusted EBITDA is appropriate as a supplemental financial measure as it is used by management to assess operating performance. We believe that Adjusted EBITDA is a useful measure in determining the Company’s per formance as it reflects certain operating drivers of the Company’s business, such as sales growth, operating costs, marketing, general and administrative expense and other operating income and expense. Adjusted EBITD A i s not a defined term under GAAP. Adjusted EBITDA is not intended to be a measure of liquidity or cash flows from operations or measures comparable to net income as it does not take into account certain requirements such as capital expenditures and related depreciation, principal and interest payments and tax payments and it includes other supplemental adjustments. Twelve Months Ended, Adjusted EBITDA¹ is Calculated as Follows (in thousands): September 30, 2011 December 31, 2011 March 31, 2012 June 30, 2012 September 30, 2012 December 31, 2012 Net Income $88,821 $126,859 $138,076 $144,883 $165,562 $168,556 Interest Expense, Net 199,092 190,187 188,488 190,711 188,019 189,930 Income Tax Expense 1,624 1,700 1,775 1,103 626 706 Depreciation and Amortization Expense 186,181 183,985 183,525 183,695 185,601 189,537 EBITDA 475,718 502,731 511,864 520,392 539,808 548,729 Other (income) Expense 113 (2,634) (3,287) (889) (4,280) (2,099) Other 5,596 5,942 6,175 5,922 4,898 9,004 Adjusted EBITDA $481,427 $506,039 $514,752 $525,425 $540,426 $555,634 Total Revenue $2,214,336 $2,219,324 $2,239,244 $2,253,892 $2,261,669 $2,276,246 Adjusted EBITDA Margin 21.7% 22.8% 23.0% 23.3% 23.9% 24.4% Twelve Months Ended, March 31, 2013 June 30, 2013 September 30, 2013 December 31, 2013 March 31, 2014 June 30, 2014 Net Income Attributable to Norwegian Cruise Line Holdings Ltd. $68,877 $24,005 $66,675 $101,714 $249,376 $369,833 Interest Expense, Net 271,416 326,197 305,628 282,602 186,118 114,292 Income Tax Expense 2,828 3,804 11,339 11,802 218 2,295 Depreciation and Amortization Expense 192,488 199,662 207,336 215,593 228,485 238,090 EBITDA 535,609 553,668 590,978 611,711 664,197 724,510 Net Income Attributable to Non-controlling Interest (1,105) (1,179) 857 1,172 2,702 4,439 Other Income (379) (2,807) (537) (1,403) (426) 328 Other 27,728 29,448 35,291 35,715 20,242 24,495 Adjusted EBITDA $561,853 $579,130 $626,589 $647,195 $686,715 $753,772 Total Revenue $2,288,447 $2,349,646 $2,473,120 $2,570,294 $2,706,691 $2,828,185 Adjusted EBITDA Margin 24.6% 24.6% 25.3% 25.2% 25.4% 26.7% NON - GAAP RECONCILING INFORMATION (UNAUDITED) 62
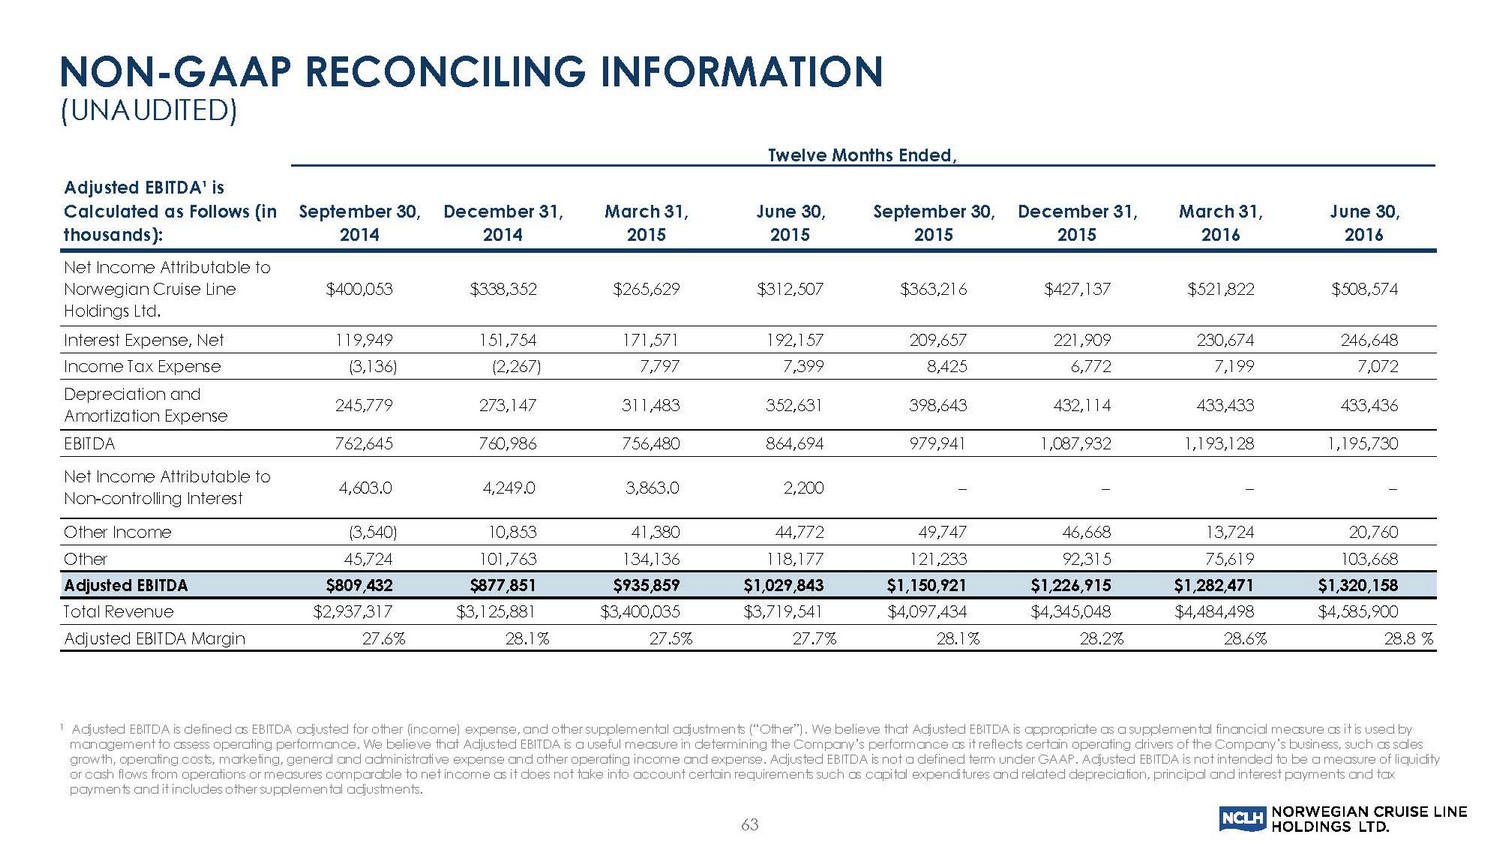
Adjusted EBITDA¹ is Calculated as Follows (in thousands): September 30, 2014 December 31, 2014 March 31, 2015 June 30, 2015 September 30, 2015 December 31, 2015 March 31, 2016 June 30, 2016 Net Income Attributable to Norwegian Cruise Line Holdings Ltd. $400,053 $338,352 $265,629 $312,507 $363,216 $427,137 $521,822 $508,574 Interest Expense, Net 119,949 151,754 171,571 192,157 209,657 221,909 230,674 246,648 Income Tax Expense (3,136) (2,267) 7,797 7,399 8,425 6,772 7,199 7,072 Depreciation and Amortization Expense 245,779 273,147 311,483 352,631 398,643 432,114 433,433 433,436 EBITDA 762,645 760,986 756,480 864,694 979,941 1,087,932 1,193,128 1,195,730 Net Income Attributable to Non-controlling Interest 4,603.0 4,249.0 3,863.0 2,200 – – – – Other Income (3,540) 10,853 41,380 44,772 49,747 46,668 13,724 20,760 Other 45,724 101,763 134,136 118,177 121,233 92,315 75,619 103,668 Adjusted EBITDA $809,432 $877,851 $935,859 $1,029,843 $1,150,921 $1,226,915 $1,282,471 $1,320,158 Total Revenue $2,937,317 $3,125,881 $3,400,035 $3,719,541 $4,097,434 $4,345,048 $4,484,498 $4,585,900 Adjusted EBITDA Margin 27.6% 28.1% 27.5% 27.7% 28.1% 28.2% 28.6% 28.8% Twelve Months Ended, 1 Adjusted EBITDA is defined as EBITDA adjusted for other (income) expense, and other supplemental adjustments (“Other”). We be l ieve that Adjusted EBITDA is appropriate as a supplemental financial measure as it is used by management to assess operating performance. We believe that Adjusted EBITDA is a useful measure in determining the Company’s per formance as it reflects certain operating drivers of the Company’s business, such as sales growth, operating costs, marketing, general and administrative expense and other operating income and expense. Adjusted EBITD A i s not a defined term under GAAP. Adjusted EBITDA is not intended to be a measure of liquidity or cash flows from operations or measures comparable to net income as it does not take into account certain requirements such as capital expenditures and related depreciation, principal and interest payments and tax payments and it includes other supplemental adjustments. NON - GAAP RECONCILING INFORMATION (UNAUDITED) 63
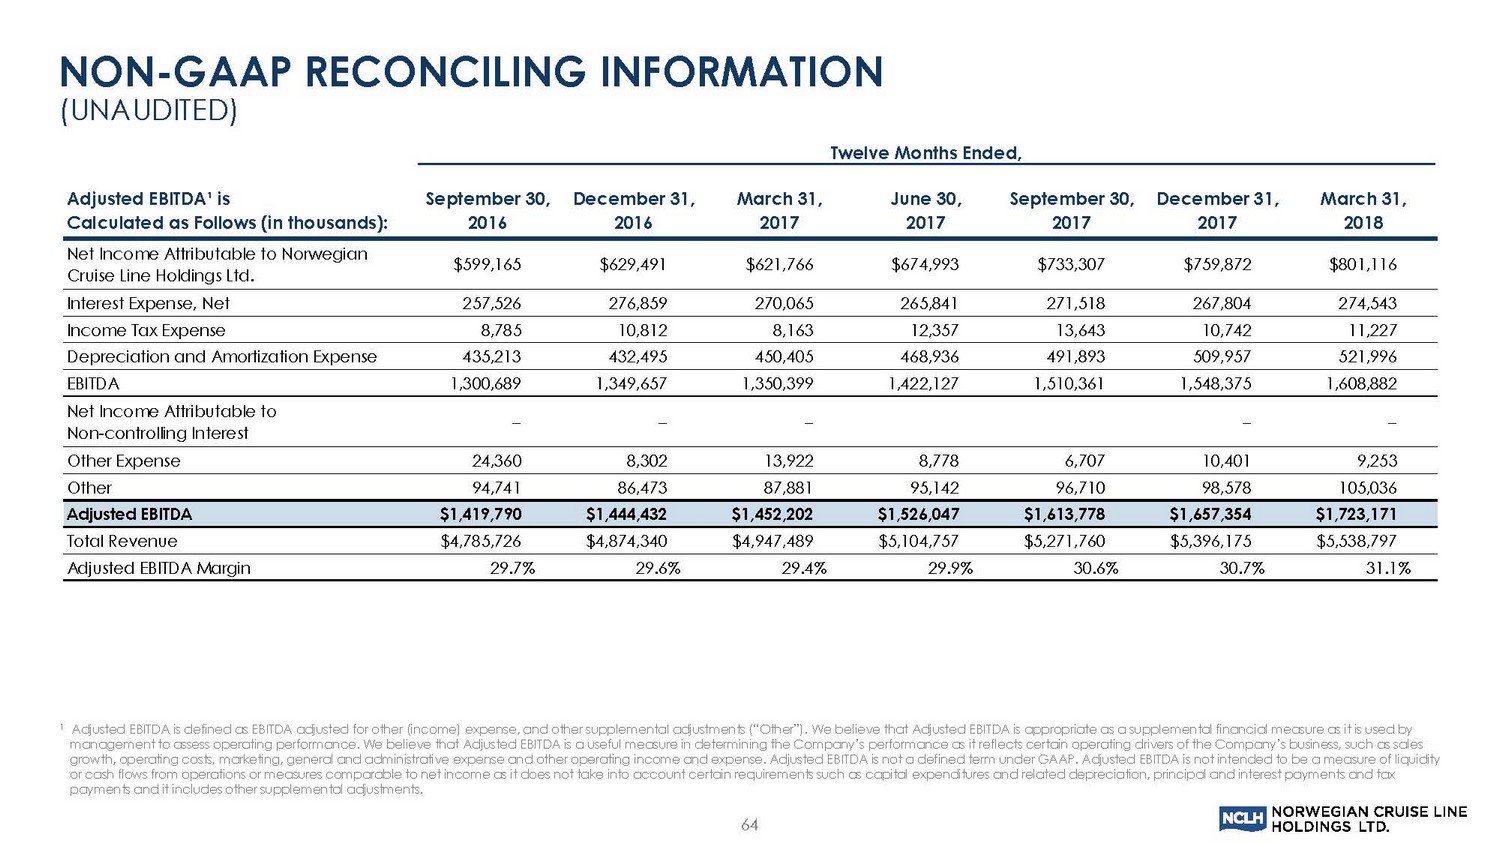
1 Adjusted EBITDA is defined as EBITDA adjusted for other (income) expense, and other supplemental adjustments (“Other”). We be l ieve that Adjusted EBITDA is appropriate as a supplemental financial measure as it is used by management to assess operating performance. We believe that Adjusted EBITDA is a useful measure in determining the Company’s per formance as it reflects certain operating drivers of the Company’s business, such as sales growth, operating costs, marketing, general and administrative expense and other operating income and expense. Adjusted EBITD A i s not a defined term under GAAP. Adjusted EBITDA is not intended to be a measure of liquidity or cash flows from operations or measures comparable to net income as it does not take into account certain requirements such as capital expenditures and related depreciation, principal and interest payments and tax payments and it includes other supplemental adjustments. Adjusted EBITDA¹ is Calculated as Follows (in thousands): September 30, 2016 December 31, 2016 March 31, 2017 June 30, 2017 September 30, 2017 December 31, 2017 March 31, 2018 Net Income Attributable to Norwegian Cruise Line Holdings Ltd. $599,165 $629,491 $621,766 $674,993 $733,307 $759,872 $801,116 Interest Expense, Net 257,526 276,859 270,065 265,841 271,518 267,804 274,543 Income Tax Expense 8,785 10,812 8,163 12,357 13,643 10,742 11,227 Depreciation and Amortization Expense 435,213 432,495 450,405 468,936 491,893 509,957 521,996 EBITDA 1,300,689 1,349,657 1,350,399 1,422,127 1,510,361 1,548,375 1,608,882 Net Income Attributable to Non-controlling Interest – – – – – Other Expense 24,360 8,302 13,922 8,778 6,707 10,401 9,253 Other 94,741 86,473 87,881 95,142 96,710 98,578 105,036 Adjusted EBITDA $1,419,790 $1,444,432 $1,452,202 $1,526,047 $1,613,778 $1,657,354 $1,723,171 Total Revenue $4,785,726 $4,874,340 $4,947,489 $5,104,757 $5,271,760 $5,396,175 $5,538,797 Adjusted EBITDA Margin 29.7% 29.6% 29.4% 29.9% 30.6% 30.7% 31.1% Twelve Months Ended, NON - GAAP RECONCILING INFORMATION (UNAUDITED) 64
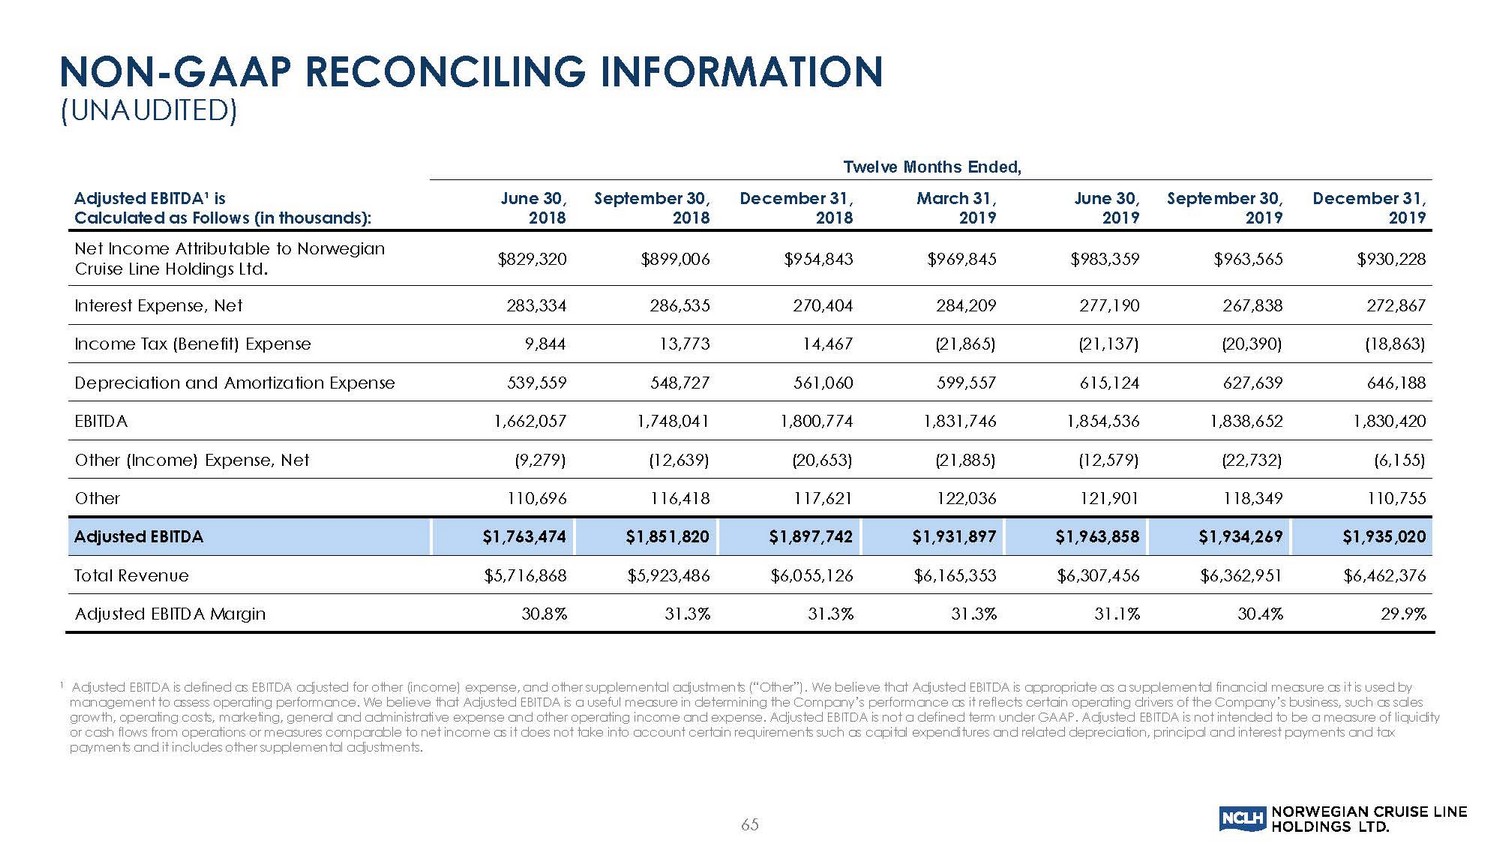
1 Adjusted EBITDA is defined as EBITDA adjusted for other (income) expense, and other supplemental adjustments (“Other”). We be l ieve that Adjusted EBITDA is appropriate as a supplemental financial measure as it is used by management to assess operating performance. We believe that Adjusted EBITDA is a useful measure in determining the Company’s per formance as it reflects certain operating drivers of the Company’s business, such as sales growth, operating costs, marketing, general and administrative expense and other operating income and expense. Adjusted EBITD A i s not a defined term under GAAP. Adjusted EBITDA is not intended to be a measure of liquidity or cash flows from operations or measures comparable to net income as it does not take into account certain requirements such as capital expenditures and related depreciation, principal and interest payments and tax payments and it includes other supplemental adjustments. Twelve Months Ended, Adjusted EBITDA¹ is Calculated as Follows (in thousands): June 30, 2018 September 30, 2018 December 31, 2018 March 31, 2019 June 30, 2019 September 30, 2019 December 31, 2019 Net Income Attributable to Norwegian Cruise Line Holdings Ltd. $829,320 $899,006 $954,843 $969,845 $983,359 $963,565 $930,228 Interest Expense, Net 283,334 286,535 270,404 284,209 277,190 267,838 272,867 Income Tax (Benefit) Expense 9,844 13,773 14,467 (21,865) (21,137) (20,390) (18,863) Depreciation and Amortization Expense 539,559 548,727 561,060 599,557 615,124 627,639 646,188 EBITDA 1,662,057 1,748,041 1,800,774 1,831,746 1,854,536 1,838,652 1,830,420 Other (Income) Expense, Net (9,279) (12,639) (20,653) (21,885) (12,579) (22,732) (6,155) Other 110,696 116,418 117,621 122,036 121,901 118,349 110,755 Adjusted EBITDA $1,763,474 $1,851,820 $1,897,742 $1,931,897 $1,963,858 $1,934,269 $1,935,020 Total Revenue $5,716,868 $5,923,486 $6,055,126 $6,165,353 $6,307,456 $6,362,951 $6,462,376 Adjusted EBITDA Margin 30.8% 31.3% 31.3% 31.3% 31.1% 30.4% 29.9% NON - GAAP RECONCILING INFORMATION (UNAUDITED) 65
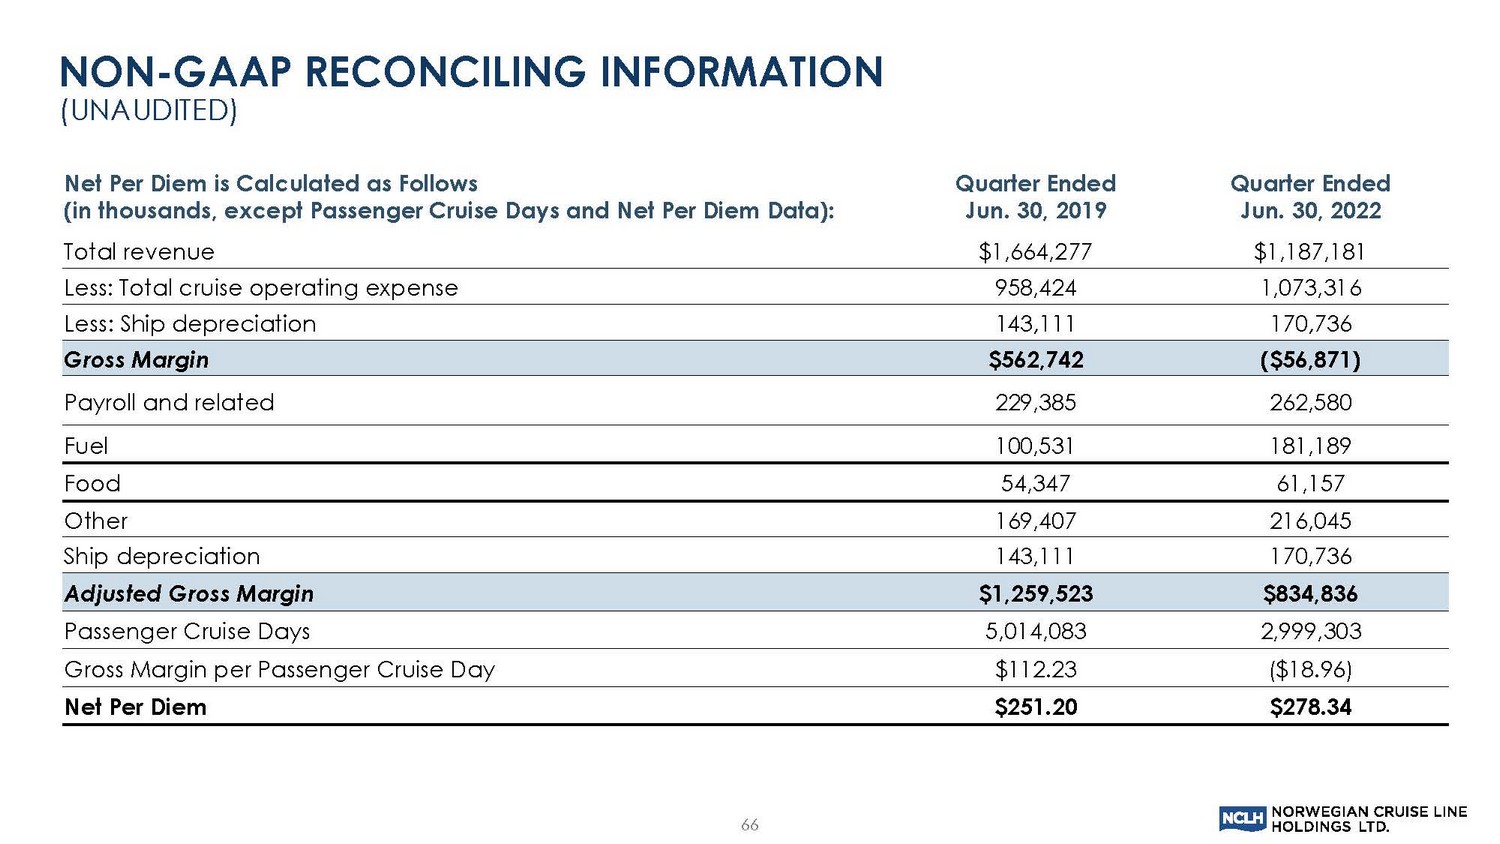
66 Net Per Diem is Calculated as Follows (in thousands, except Passenger Cruise Days and Net Per Diem Data): Quarter Ended Jun. 30, 2019 Quarter Ended Jun. 30, 2022 Total revenue $1,664,277 $1,187,181 Less: Total cruise operating expense 958,424 1,073,316 Less: Ship depreciation 143,111 170,736 Gross Margin $562,742 ($56,871) Payroll and related 229,385 262,580 Fuel 100,531 181,189 Food 54,347 61,157 Other 169,407 216,045 Ship depreciation 143,111 170,736 Adjusted Gross Margin $1,259,523 $834,836 Passenger Cruise Days 5,014,083 2,999,303 Gross Margin per Passenger Cruise Day $112.23 ($18.96) Net Per Diem $251.20 $278.34 NON - GAAP RECONCILING INFORMATION (UNAUDITED)
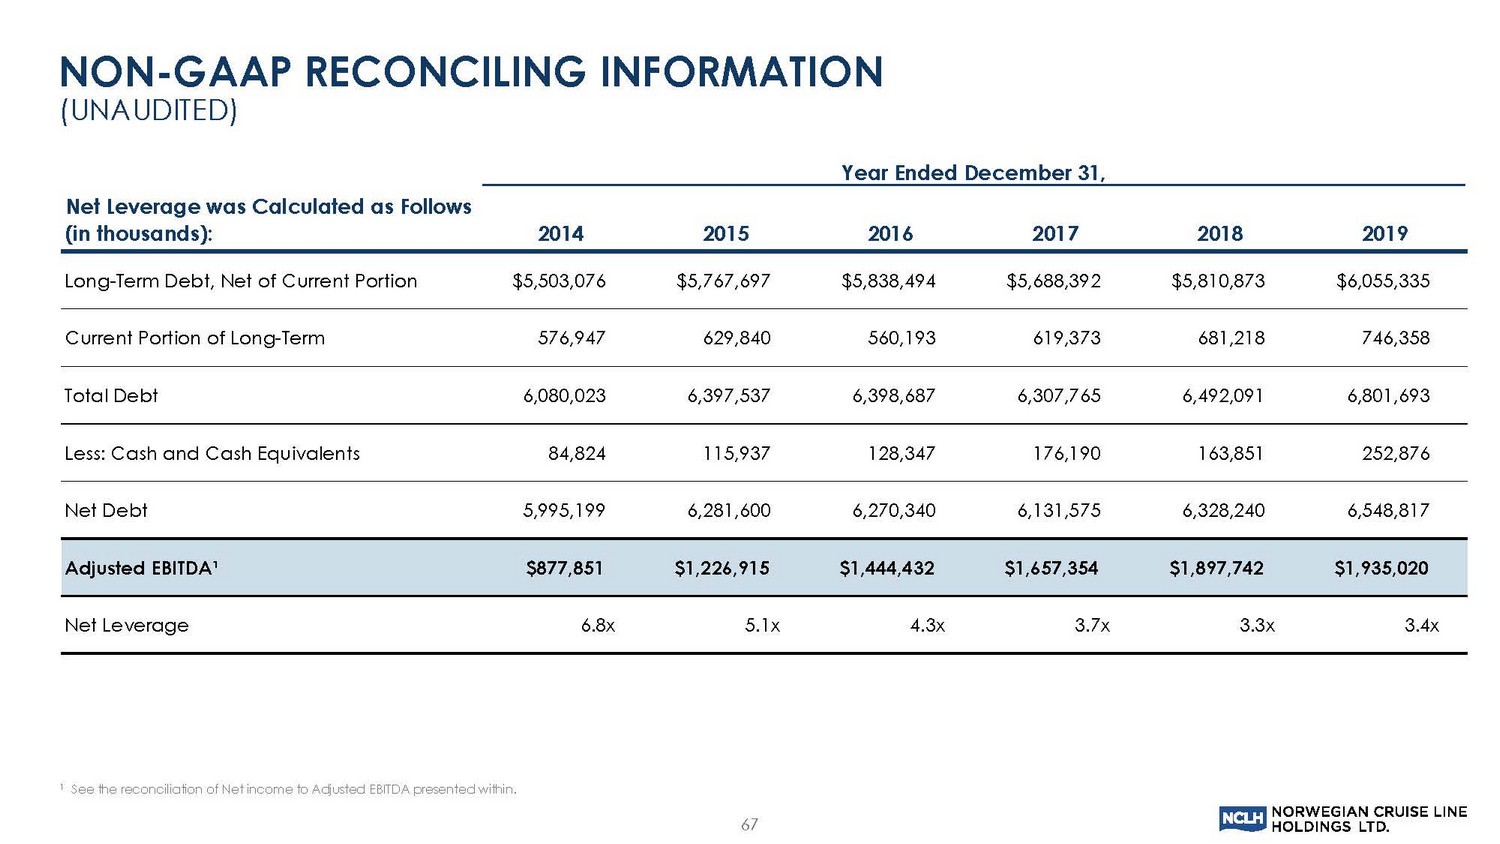
1 See the reconciliation of Net income to Adjusted EBITDA presented within. Net Leverage was Calculated as Follows (in thousands): 2014 2015 2016 2017 2018 2019 Long-Term Debt, Net of Current Portion $5,503,076 $5,767,697 $5,838,494 $5,688,392 $5,810,873 $6,055,335 Current Portion of Long-Term 576,947 629,840 560,193 619,373 681,218 746,358 Total Debt 6,080,023 6,397,537 6,398,687 6,307,765 6,492,091 6,801,693 Less: Cash and Cash Equivalents 84,824 115,937 128,347 176,190 163,851 252,876 Net Debt 5,995,199 6,281,600 6,270,340 6,131,575 6,328,240 6,548,817 Adjusted EBITDA¹ $877,851 $1,226,915 $1,444,432 $1,657,354 $1,897,742 $1,935,020 Net Leverage 6.8x 5.1x 4.3x 3.7x 3.3x 3.4x Year Ended December 31, NON - GAAP RECONCILING INFORMATION (UNAUDITED) 67