Exhibit 99.3
NORWEGIAN CRUISE LINE HOLDINGS LTD.
ACQUISITION OF PRESTIGE CRUISES INTERNATIONAL, INC.
SEPTEMBER 2, 2014

MANAGEMENT PRESENTERS
Kevin Sheehan
President and
Chief Executive Officer
Norwegian Cruise Line Holdings Ltd.
Frank Del Rio
Chairman and
Chief Executive Officer
Prestige Cruises International, Inc.
Wendy Beck
Executive Vice-president and Chief Financial Officer
Norwegian Cruise Line Holdings Ltd.
Andrea DeMarco
Director, Investor Relations
Norwegian Cruise Line Holdings Ltd
FORWARD LOOKING STATEMENTS
This presentation may contain statements, estimates or projections that constitute “forward-looking statements” as defined under U.S. federal securities laws. Generally, the words “will,” “may,” “believes,” “expects,” “intends,” “anticipates,” ”projects,” “plans,” “seeks,” and similar expressions are intended to identify forward-looking statements, which are not historical in nature.
Forward-looking statements are based on management’s current expectations and assumptions, and are subject to significant business, economic, regulatory and competitive risks and uncertainties (many of which are beyond the control of the company and management) that could cause actual results, performance or achievements to differ significantly from Norwegian’s historical results or those implied in forward-looking statements. You should not place undue reliance on forward-looking statements as a prediction of actual results. Norwegian expressly disclaims any obligation or undertaking to release publicly any updates or revisions to any forward-looking statements to reflect any change in expectations or events, conditions or circumstances on which any such statements are based. For a discussion of some of the important factors that could cause these variations, please consult the “Risk Factors” section of the prospectus filed with the SEC.
We use certain non-GAAP financial measures in this presentation, such as EBITDA, Adjusted EBITDA, net onboard yield, and compound annual growth rate, to enable us to analyze our performance. We utilize these financial measures to manage our business on a day-to-day basis and believe that they are the most relevant measures of our financial performance. Some of these measures are commonly used in the cruise industry to measure performance. Our use of a non-GAAP financial measure may not be comparable to other companies within our industry. For a discussion concerning non-GAAP financial measures, please refer to our respective filings with the SEC.
This information is confidential, and should not be photocopied, distributed or disclosed to anyone other than to whom it is provided, and your acceptance of this document is deemed to be an agreement to these terms.
ADDITIONAL INFORMATION ABOUT THE TRANSACTION
The transaction discussed in this presentation is being provided for informational purposes only. WE ARE NOT ASKING FOR
A PROXY, AND YOU ARE REQUESTED NOT TO SEND A PROXY.
In connection with the transaction, we will file relevant materials with the SEC, including a Schedule 14C information statement. Investors and security holders are urged to read these documents (if and when they become available) and any other relevant documents filed with the SEC, as well as any amendments or supplements to those documents, because they will include important information about Prestige, Norwegian, and the transaction. Investors and stockholders will be able to obtain free copies of the information statement and other documents containing important information about Prestige and Norwegian, once such documents are filed with the SEC by Norwegian, through the website maintained by the SEC at http://www.sec.gov. Copies of the documents filed with the SEC by [Norwegian] will be available free of charge of
[Norwegian’s] investor relations website at www.investor.ncl.com or by contacting Norwegian’s Investor Relations
Department at 305-468-2339.
This presentation is not intended to and does not constitute an offer to sell or the solicitation of an offer to subscribe for or buy or an invitation to purchase or subscribe for any securities or the solicitation of any vote or approval in any jurisdiction pursuant to the acquisition or otherwise.
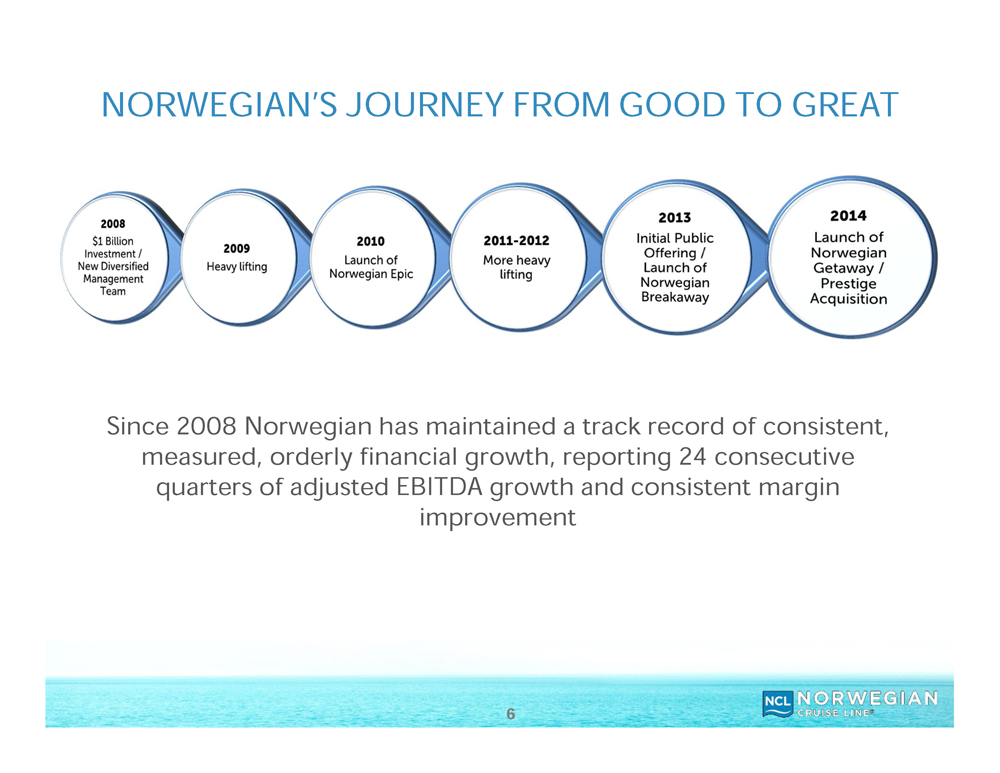
NORWEGIAN’S JOURNEY FROM GOOD TO GREAT
Since 2008 Norwegian has maintained a track record of consistent, measured, orderly financial growth, reporting 24 consecutive quarters of adjusted EBITDA growth and consistent margin improvement
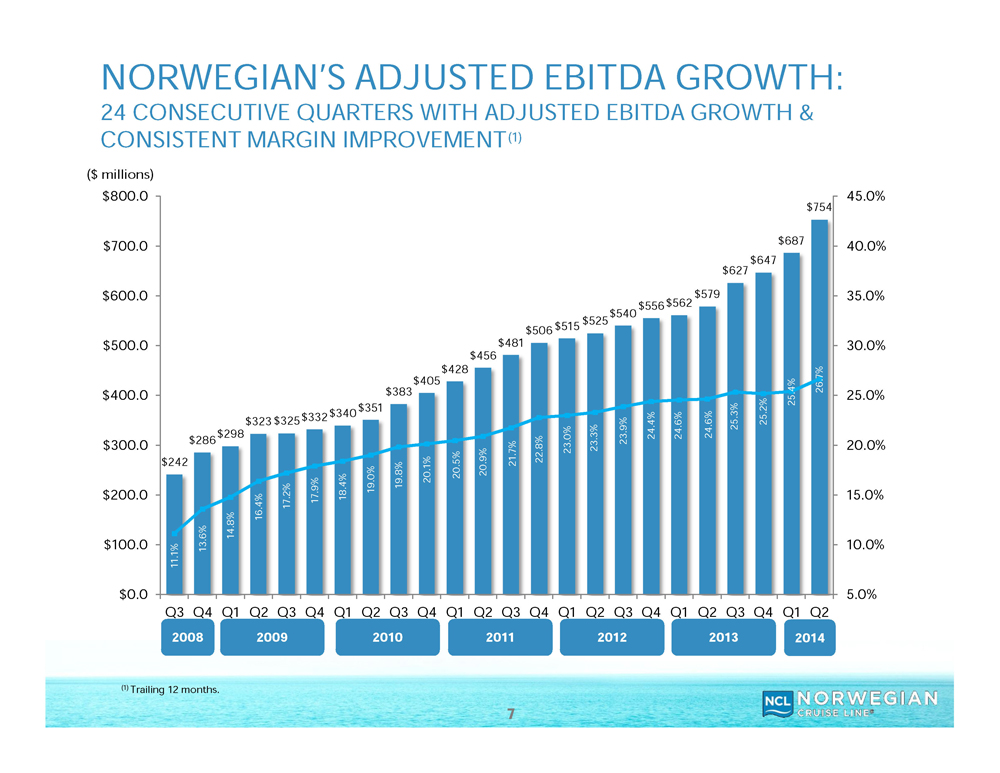
NORWEGIAN’S ADJUSTED EBITDA GROWTH:
24 CONSECUTIVE QUARTERS WITH ADJUSTED EBITDA GROWTH & CONSISTENT MARGIN IMPROVEMENT(1)
COMPELLING STRATEGIC RATIONALE
Combination creates a diversified, industry-leading cruise operating company
Three complementary brands with presence across market segments
Further enhances industry-leading financial metrics
Sharing of best practices among brands and synergies from breadth of scale
Increases economies of scale providing greater operational leverage
Expands growth trajectory and global footprint
Complementary new build programs provides measured, orderly capacity growth annually through 2019
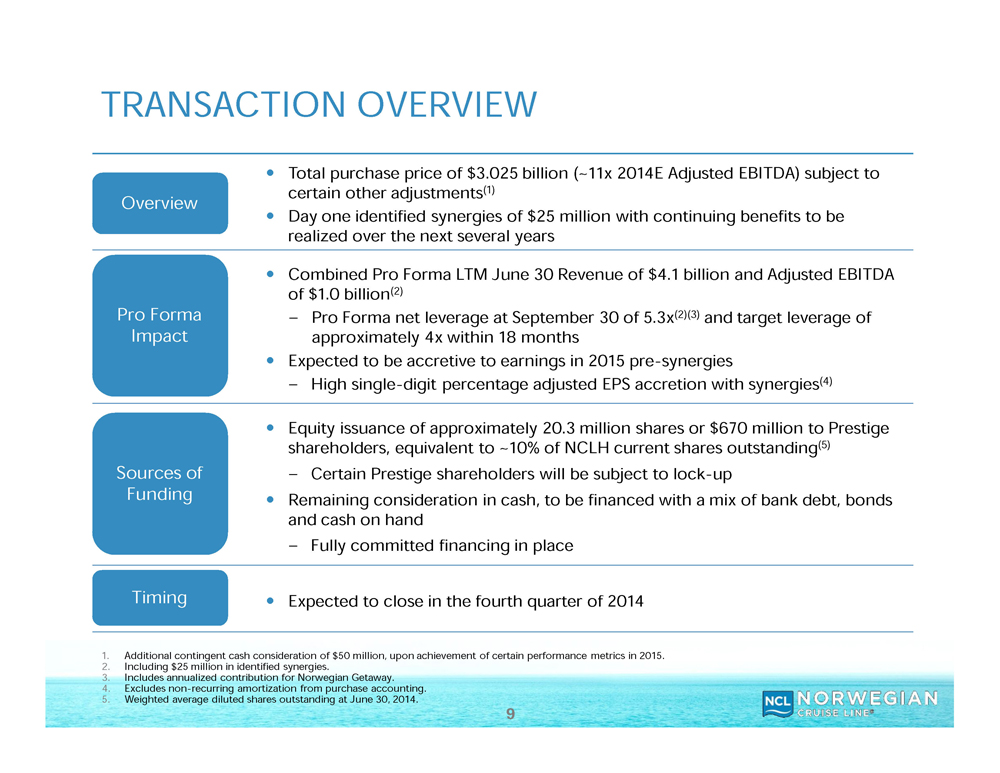
TRANSACTION OVERVIEW
Total purchase price of $3.025 billion (~11x 2014E Adjusted EBITDA) subject to certain other adjustments(1)
Overview
Day one identified synergies of $25 million with continuing benefits to be realized over the next several years
Combined Pro Forma LTM June 30 Revenue of $4.1 billion and Adjusted EBITDA of $1.0 billion(2) Pro Forma Pro Forma net leverage at September 30 of 5.3x(2)(3) and target leverage of Impactapproximately 4x within 18 months Expected to be accretive to earnings in 2015 pre-synergies
High single-digit percentage adjusted EPS accretion with synergies(4)
Equity issuance of approximately 20.3 million shares or $670 million to Prestige shareholders, equivalent to ~10% of NCLH current shares outstanding(5) Sources of Certain Prestige shareholders will be subject to lock-up Funding Remaining consideration in cash, to be financed with a mix of bank debt, bonds and cash on hand
Fully committed financing in place
Timing Expected to close in the fourth quarter of 2014
1. Additional contingent cash consideration of $50 million, upon achievement of certain performance metrics in 2015.
2. Including $25 million in identified synergies.
3. Includes annualized contribution for Norwegian Getaway.
4. Excludes non-recurring amortization from purchase accounting.
5. Weighted average diluted shares outstanding at June 30, 2014.
PRESTIGE CRUISES INTERNATIONAL OVERVIEW
Global leader in the upscale cruise segment with approximately 46% of berth capacity
Operates two brands, Oceania Cruises and Regent Seven Seas Cruises
8 ships, approximately 6,500 berths with 87% balconies
Loyal followings with high repeat guest rates
Among the highest space-to-guest and crew to passenger ratios in the industry, providing guests with unparalleled accommodations and individually-tailored service levels
Brands cater to affluent and seasoned travelers
Guests are less impacted by recessionary pressures
Attractive financial characteristics
Industry-leading net yield
High visibility to future bookings
Strong EBITDA and earnings growth
Note: Upscale refers to Upper Premium and Luxury segments.
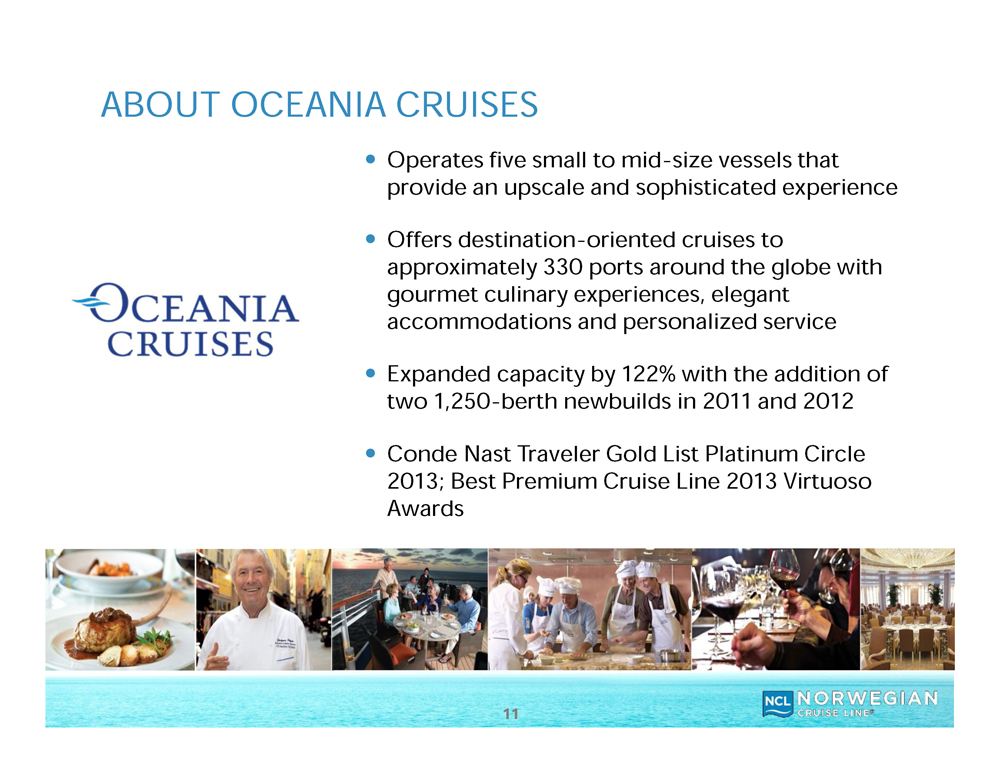
ABOUT OCEANIA CRUISES
Operates five small to mid-size vessels that provide an upscale and sophisticated experience
Offers destination-oriented cruises to approximately 330 ports around the globe with gourmet culinary experiences, elegant accommodations and personalized service
Expanded capacity by 122% with the addition of two 1,250-berth newbuilds in 2011 and 2012
Conde Nast Traveler Gold List Platinum Circle 2013; Best Premium Cruise Line 2013 Virtuoso Awards
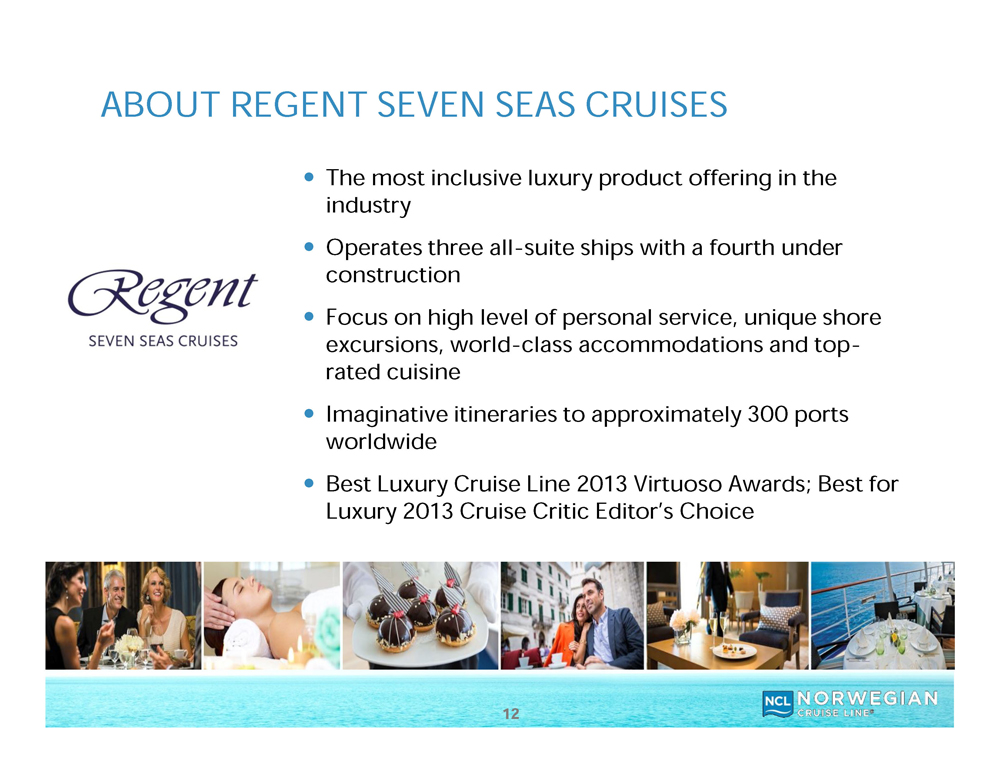
ABOUT REGENT SEVEN SEAS CRUISES
The most inclusive luxury product offering in the industry
Operates three all-suite ships with a fourth under construction
Focus on high level of personal service, unique shore excursions, world-class accommodations and top-rated cuisine
Imaginative itineraries to approximately 300 ports worldwide
Best Luxury Cruise Line 2013 Virtuoso Awards; Best for Luxury 2013 Cruise Critic Editor’s Choice
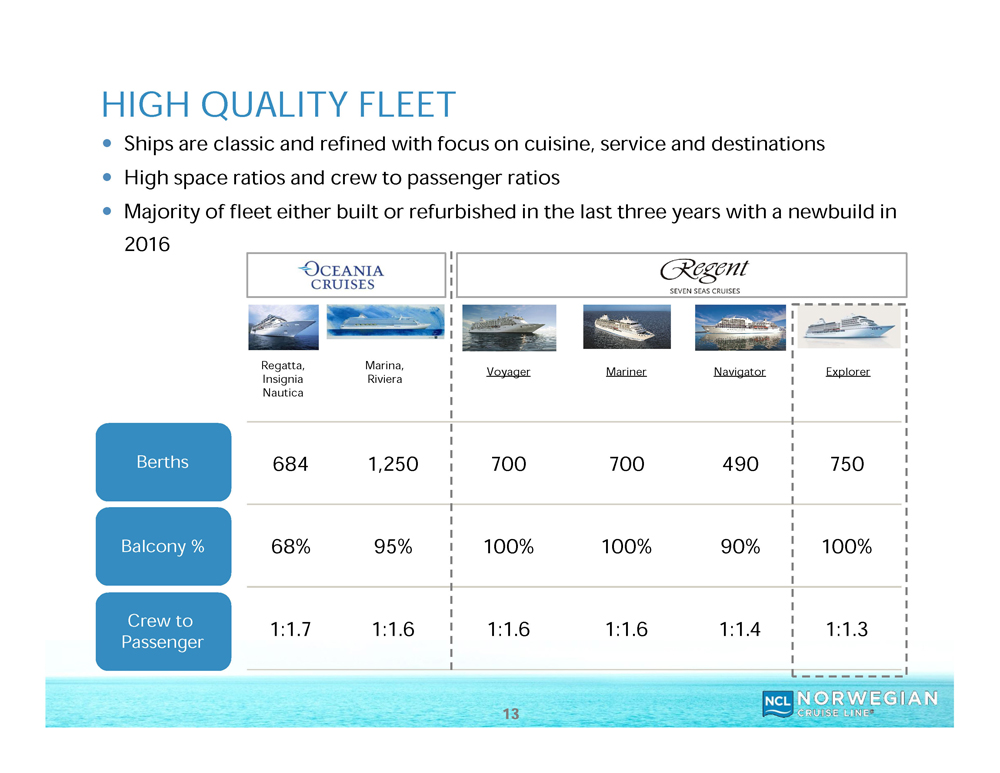
HIGH QUALITY FLEET
Ships are classic and refined with focus on cuisine, service and destinations High space ratios and crew to passenger ratios Majority of fleet either built or refurbished in the last three years with a newbuild in 2016
Regatta, Insignia Nautica
Marina, Riviera
Voyager
Mariner
Navigator
Explorer
Berths 684 1,250 700 700 490 750
Balcony % 68% 95% 100% 100% 90% 100%
Crew to
1:1.7 1:1.6 1:1.6 1:1.6 1:1.4 1:1.3
Passenger
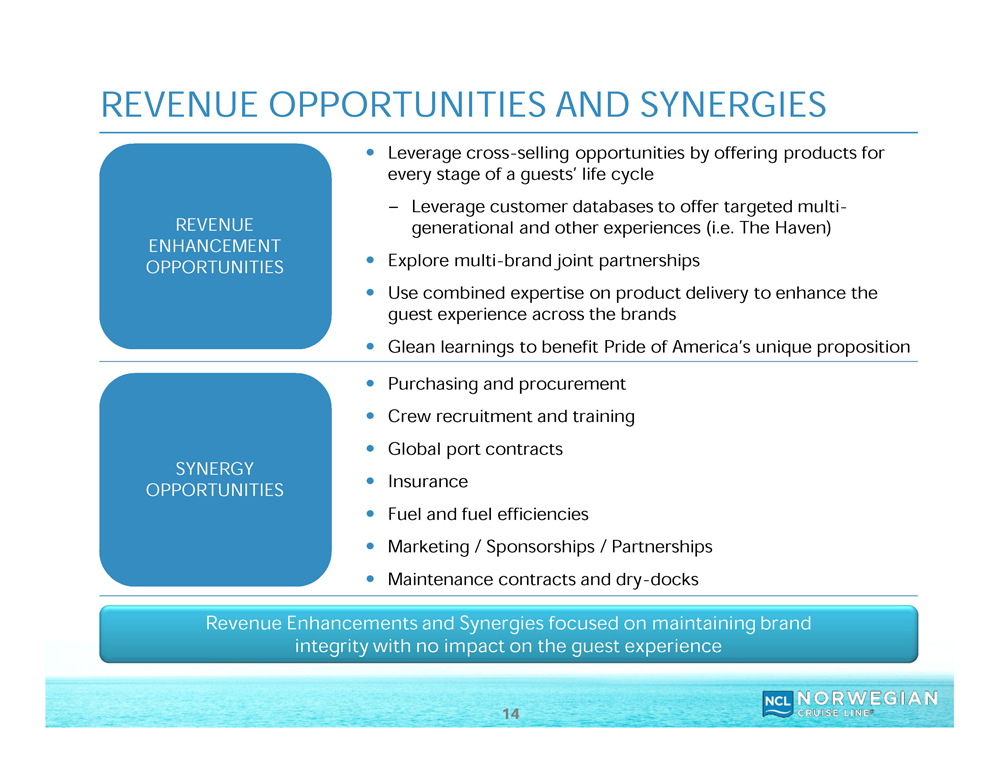
REVENUE OPPORTUNITIES AND SYNERGIES
Leverage cross-selling opportunities by offering products for every stage of a guests’ life cycle
Leverage customer databases to offer targeted multi-REVENUE generational and other experiences (i.e. The Haven)
ENHANCEMENT
Explore multi-brand joint partnerships
OPPORTUNITIES
Use combined expertise on product delivery to enhance the guest experience across the brands
Glean learnings to benefit Pride of America’s unique proposition Purchasing and procurement Crew recruitment and training
Global port contracts
SYNERGY
Insurance
OPPORTUNITIES
Fuel and fuel efficiencies
Marketing / Sponsorships / Partnerships
Maintenance contracts and dry-docks
Revenue Enhancements and Synergies focused on maintaining brand integrity with no impact on the guest experience
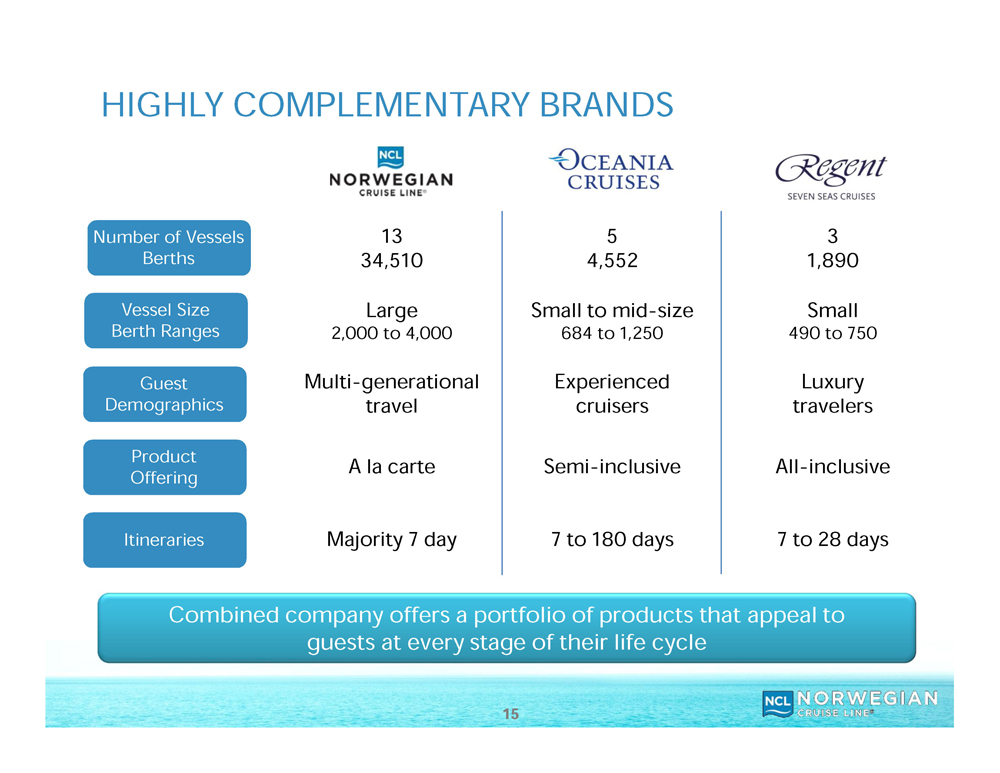
HIGHLY COMPLEMENTARY BRANDS
Number of Vessels 13 5 3
Berths 34,510 4,552 1,890
Vessel Size Large Small to mid-size Small
Berth Ranges 2,000 to 4,000 684 to 1,250 490 to 750
Guest Multi-generational Experienced Luxury Demographics travel cruisers travelers
Product
A la carte Semi-inclusive All-inclusive
Offering
Itineraries Majority 7 day 7 to 180 days 7 to 28 days
Combined company offers a portfolio of products that appeal to guests at every stage of their life cycle
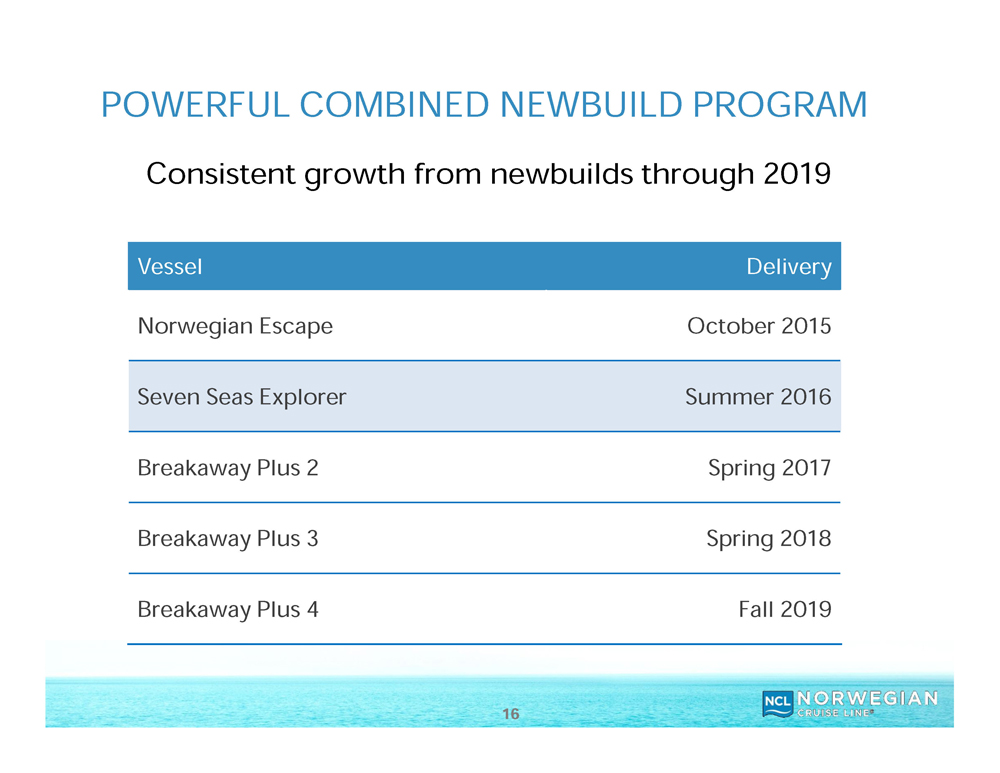
POWERFUL COMBINED NEWBUILD PROGRAM
Consistent growth from newbuilds through 2019
Vessel Delivery Norwegian Escape October 2015 Seven Seas Explorer Summer 2016 Breakaway Plus 2 Spring 2017 Breakaway Plus 3 Spring 2018 Breakaway Plus 4 Fall 2019
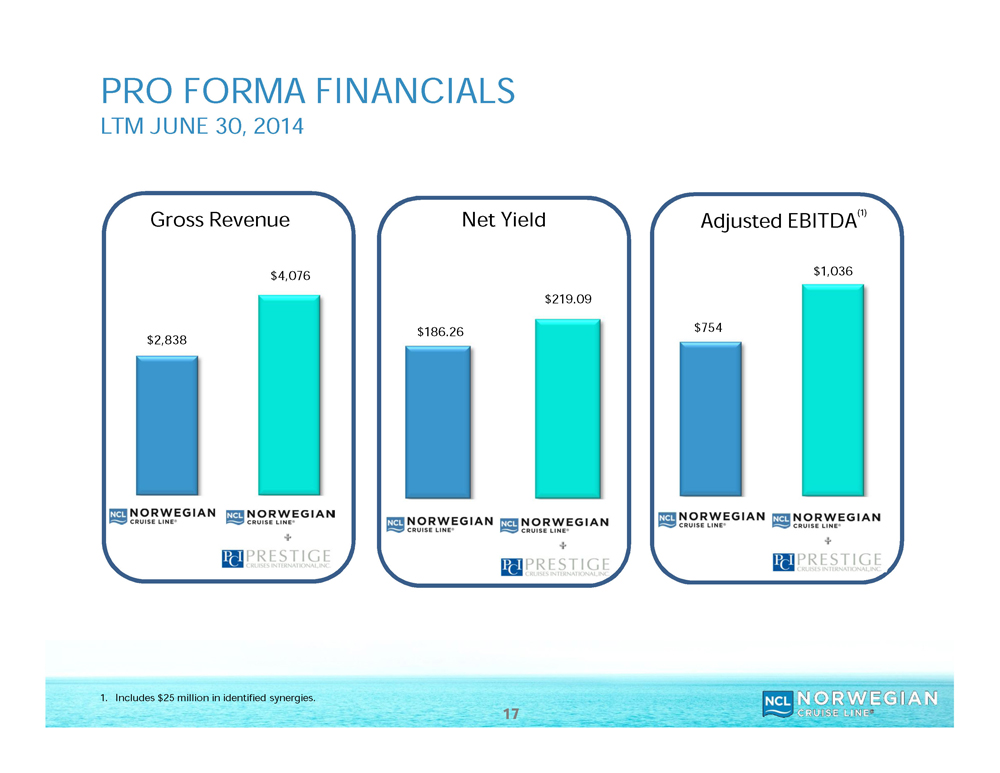
PRO FORMA FINANCIALS
LTM JUNE 30, 2014
Gross Revenue
Net Yield
Adjusted EBITDA(1)
1. Includes $25 million in identified synergies.
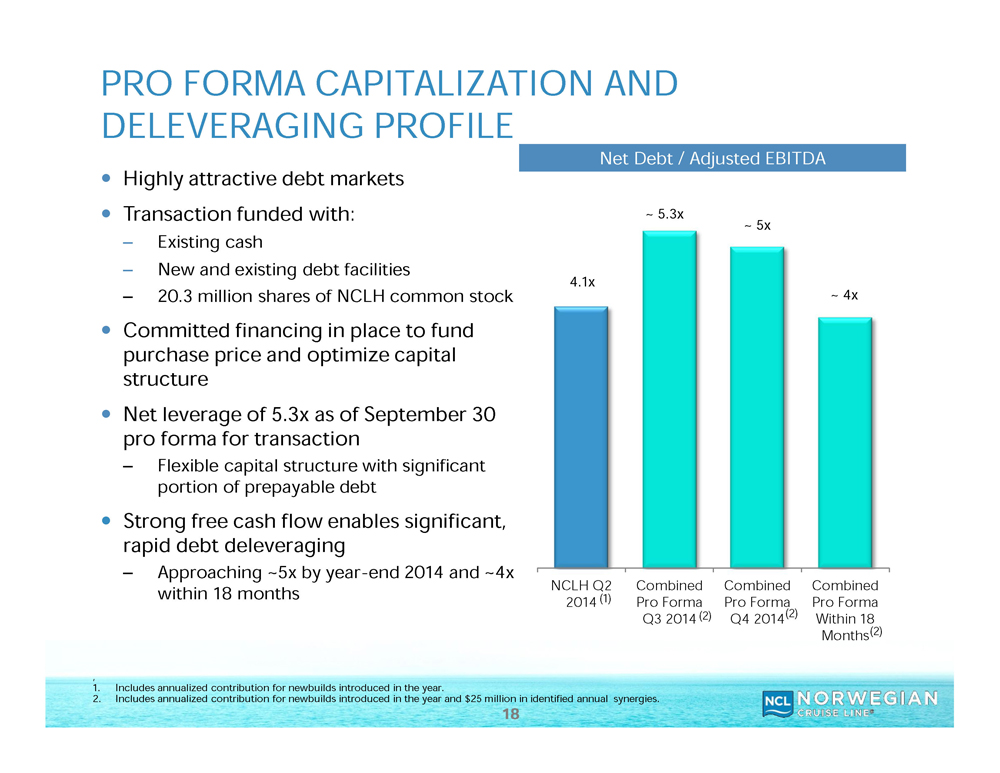
PRO FORMA CAPITALIZATION AND DELEVERAGING PROFILE
Net Debt / Adjusted EBITDA
Highly attractive debt markets
Transaction funded with:
– Existing cash
– New and existing debt facilities
– 20.3 million shares of NCLH common stock
Committed financing in place to fund purchase price and optimize capital structure
Net leverage of 5.3x as of September 30 pro forma for transaction
– Flexible capital structure with significant portion of prepayable debt
Strong free cash flow enables significant, rapid debt deleveraging
– Approaching ~5x by year-end 2014 and ~4x within 18 months
1. Includes annualized contribution for newbuilds introduced in the year.
2. Includes annualized contribution for newbuilds introduced in the year and $25 million in identified annual synergies.
IN CONCLUSION, THIS TRANSACTION:
Combines Three Successful, Complementary Brands Across Different Market Segments Will Retain Distinct Brand Proposition, Guest Experience and Culture of Brands Enhances Already Best-In-Class Financial Metrics Expands Growth Trajectory with Measured Orderly Capacity Growth Through 2019 Is Immediately Accretive on a non-GAAP, Adjusted EPS Basis Provides Significant Synergies with Benefits for Years to Come

NORWEGIAN CRUISE LINE HOLDINGS LTD.
ACQUISITION OF PRESTIGE CRUISES INTERNATIONAL, INC.
SEPTEMBER 2, 2014
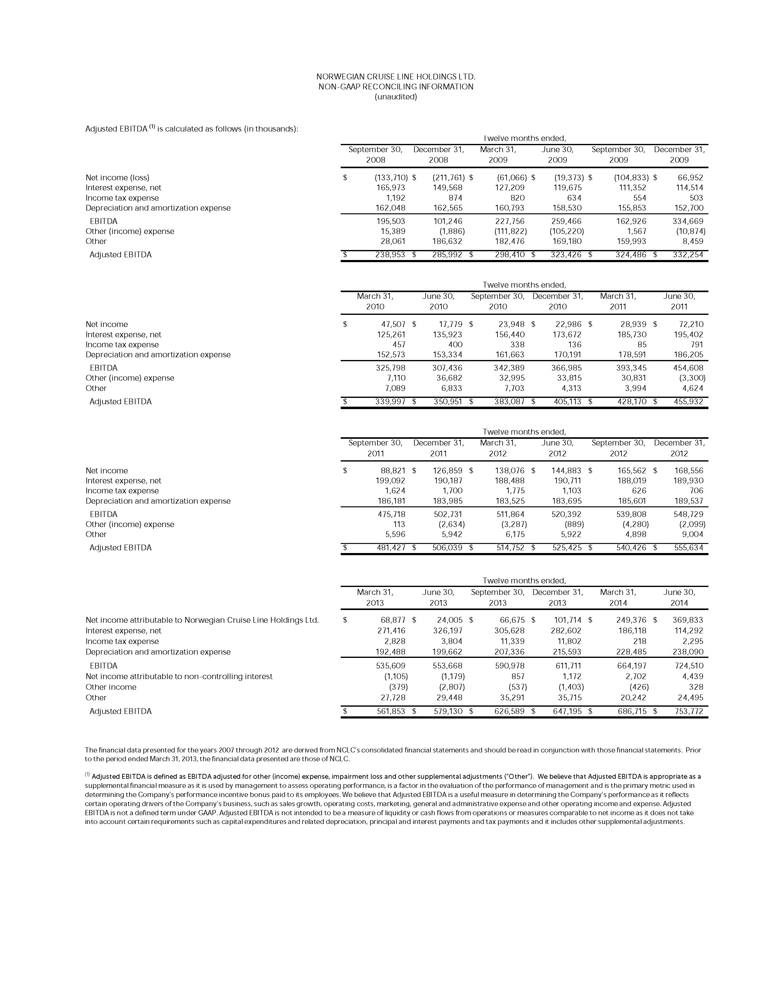
NORWEGIAN CRUISE LINE HOLDINGS LTD. NON-GAAP RECONCIL
ING INFORMATION
(unaudited)
Adjusted EBITDA (1) is calculated as follows (in thousands):
Twelve months ended,
September 30, December 31, March 31, June 30, September 30, December 31,
2008 2008 2009 2009 2009 2009
Net income (loss) $ (133,710) $ (211,761) $ (61,066) $ (19,373) $ (104,833) $ 66,952
Interest expense, net 165,973 149,568 127,209 119,675 111,352 114,514
Income tax expense 1,192 874 820 634 554 503
Depreciation and amortization expense 162,048 162,565 160,793 158,530 155,853 152,700
EBITDA 195,503 101,246 227,756 259,466 162,926 334,669
Other (income) expense 15,389 (1,886) (111,822) (105,220) 1,567 (10,874)
Other 28,061 186,632 182,476 169,180 159,993 8,459
Adjusted EBITDA $ 238,953 $ 285,992 $ 298,410 $ 323,426 $ 324,486 $ 332,254
Twelve months ended,
March 31, June 30, September 30, December 31, March 31, June 30,
2010 2010 2010 2010 2011 2011
Net income $ 47,507 $ 17,779 $ 23,948 $ 22,986 $ 28,939 $ 72,210
Interest expense, net 125,261 135,923 156,440 173,672 185,730 195,402
Income tax expense 457 400 338 136 85 791
Depreciation and amortization expense 152,573 153,334 161,663 170,191 178,591 186,205
EBITDA 325,798 307,436 342,389 366,985 393,345 454,608
Other (income) expense 7,110 36,682 32,995 33,815 30,831 (3,300)
Other 7,089 6,833 7,703 4,313 3,994 4,624
Adjusted EBITDA $ 339,997 $ 350,951 $ 383,087 $ 405,113 $ 428,170 $ 455,932
Twelve months ended,
September 30, December 31, March 31, June 30, September 30, December 31,
2011 2011 2012 2012 2012 2012
Net income $ 88,821 $ 126,859 $ 138,076 $ 144,883 $ 165,562 $ 168,556
Interest expense, net 199,092 190,187 188,488 190,711 188,019 189,930
Income tax expense 1,624 1,700 1,775 1,103 626 706
Depreciation and amortization expense 186,181 183,985 183,525 183,695 185,601 189,537
EBITDA 475,718 502,731 511,864 520,392 539,808 548,729
Other (income) expense 113 (2,634) (3,287) (889) (4,280) (2,099)
Other 5,596 5,942 6,175 5,922 4,898 9,004
Adjusted EBITDA $ 481,427 $ 506,039 $ 514,752 $ 525,425 $ 540,426 $ 555,634
Twelve months ended,
March 31, June 30, September 30, December 31, March 31, June 30,
2013 2013 2013 2013 2014 2014
Net income attributable to Norwegian Cruise Line Holdings Ltd. $ 68,877 $ 24,005 $ 66,675 $ 101,714 $ 249,376 $ 369,833
Interest expense, net 271,416 326,197 305,628 282,602 186,118 114,292
Income tax expense 2,828 3,804 11,339 11,802 218 2,295
Depreciation and amortization expense 192,488 199,662 207,336 215,593 228,485 238,090
EBITDA 535,609 553,668 590,978 611,711 664,197 724,510
Net income attributable to non-controlling interest (1,105) (1,179) 857 1,172 2,702 4,439
Other income (379) (2,807) (537) (1,403) (426) 328
Other 27,728 29,448 35,291 35,715 20,242 24,495
Adjusted EBITDA $ 561,853 $ 579,130 $ 626,589 $ 647,195 $ 686,715 $ 753,772
The financial data presented for the years 2007 through 2012 are derived from NCLC’s consolidated financial statements and should be read in conjunction with those financial statements. Prior to the period ended March 31, 2013, the financial data presented are those of NCLC.
(1) Adjusted EBITDA is defined as EBITDA adjusted for other (income) expense, impairment loss and other supplemental adjustments (“Other”). We believe that Adjusted EBITDA is appropriate as a supplemental financial measure as it is used by management to assess operating performance, is a factor in the evaluation of the performance of management and is the primary metric used in determining the Company’s performance incentive bonus paid to its employees. We believe that Adjusted EBITDA is a useful measure in determining the Company’s performance as it reflects certain operating drivers of the Company’s business, such as sales growth, operating costs, marketing, general and administrative expense and other operating income and expense. Adjusted EBITDA is not a defined term under GAAP. Adjusted EBITDA is not intended to be a measure of liquidity or cash flows from operations or measures comparable to net income as it does not take into account certain requirements such as capital expenditures and related depreciation, principal and interest payments and tax payments and it includes other supplemental adjustments.